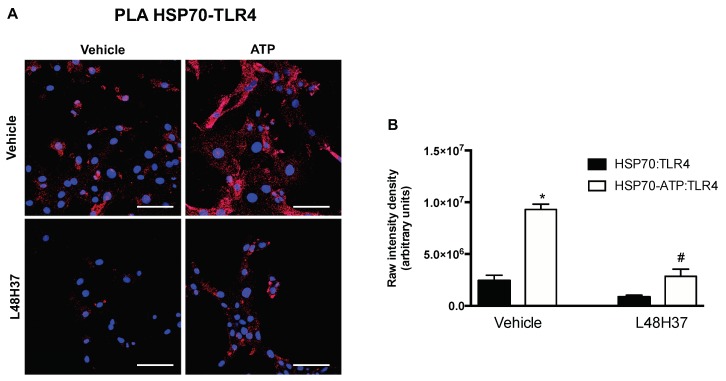
Figure 5.
Proximity ligation assay produced red fluorescence spots, which suggests both target proteins (HSP70-TLR4) within interacting range. (A) Representative images (Scale bar: 20 m). (B) The raw fluorescence intensity (red) was analyzed using the ImageJ software. n = 6 images per group. * p < 0.05 vs. HSP70:TLR4 vehicle treated and # p < 0.05 vs. HSP70-ATP:TLR4.

