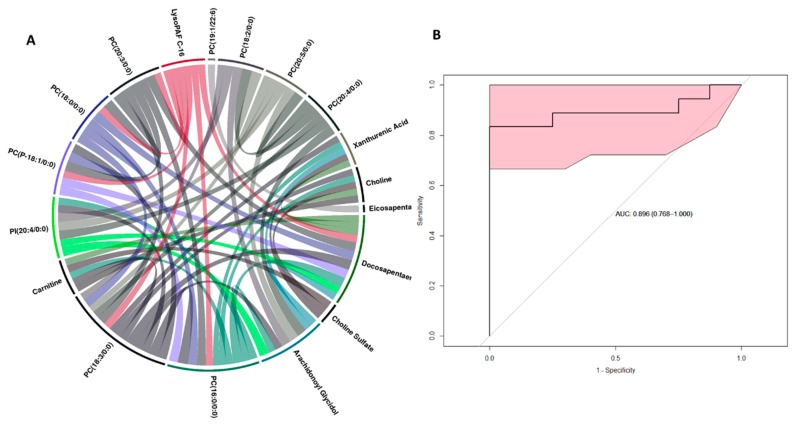
Figure 3.
Metabolite correlates of radiation response in NHP liver. Panel A. Circos plot visualization of Spearman correlation values between 18 top cut-off point p-value < 1 × 10⁻³⁰. Panel B. The ROC curve with a six-metabolite panel predictive of post-irradiation survival in NHPs liver. The classification algorithm showed sensitivity = 0.833, specificity= 0.875, AUC: 0.869, and a predictive accuracy of 0.846.

