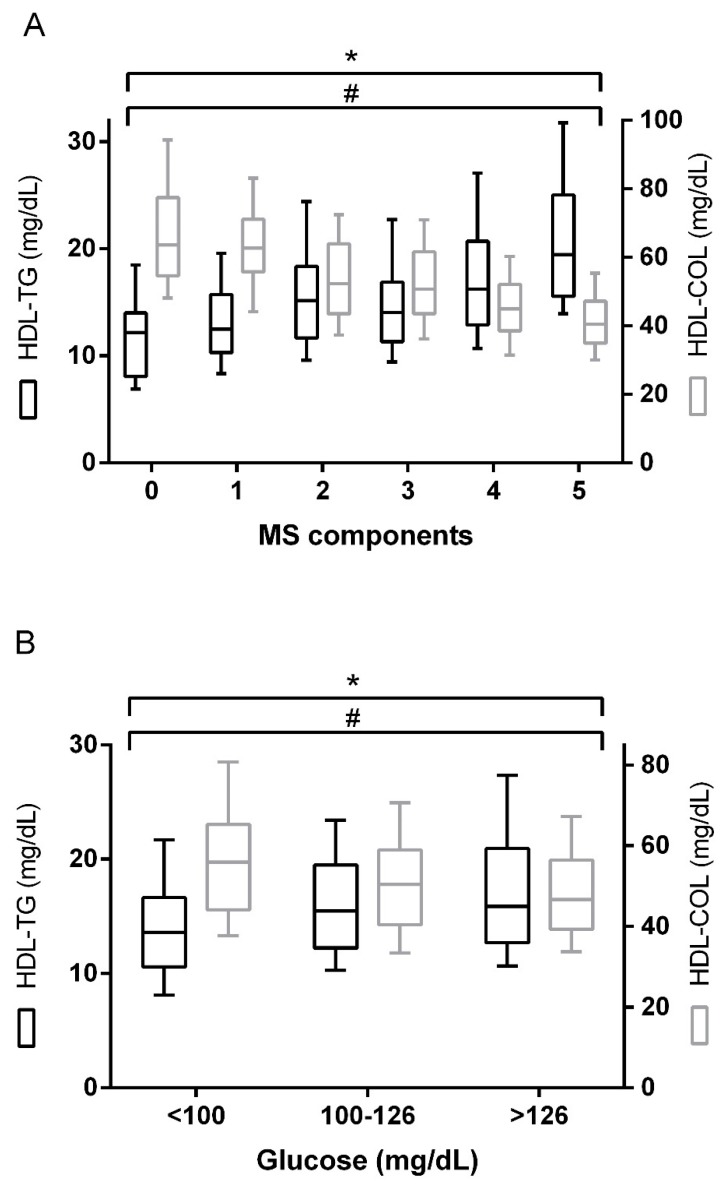
Figure 2.
HDL-TG and HDL-C levels according to metabolic syndrome (MS) components (A) and diabetes status (B). The data are presented as box-plot. p values for group comparison are reported for the Kruskal–Wallis test. * p < 0.001 for the trend, HDL-TG; # p < 0.001 for the trend, HDL-C. MS components: 0 (n = 32); 1 (n = 42); 2 (n = 77); 3 (n = 126); 4 (n = 139); 5 (n = 86). Diabetes status: <100 (n = 112); 100–126 (n = 134); >126 (n = 256).

