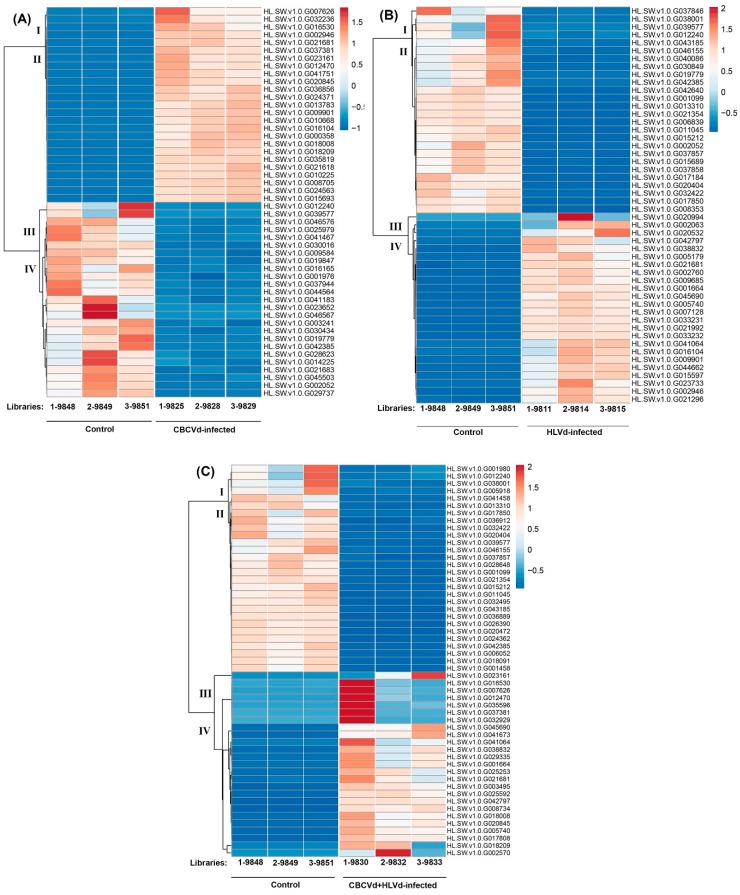
Figure 6.
Heat map and complete linkage hierarchical clustering of differentially expressed genes in CBCVd infected (A), HLVd infected (B) and HLVd-CBCVd coinfected (C) hop. Colors on vertical represent the clustered genes based on gene expression, the horizontal line represents the single gene, and color of the line indicates the average gene expression in single and mixed CBCVd, HLVd infection. The signal ratios were shown in a blue-orange-red color scale, where red indicated high expression level and blue indicated low expression level.

