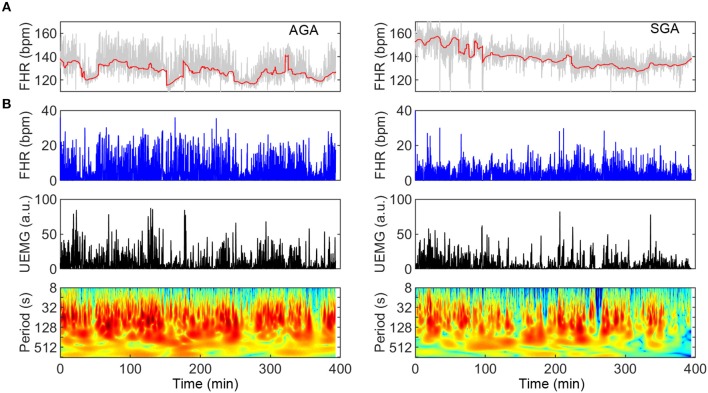
Figure 3.
Comparison of UEMG-FHR coupling spectrums of a typical AGA fetus and an SGA fetus (left panels: AGA; right panels: SGA). (A) About 400-min digitized UEMG and FHR time series of two fetuses aged 35 weeks. From the FHR baseline (red line) fluctuation, the AGA fetus has an apparent sleep cycle, but SGA hardly observes it. (B) UEMG-FHR coupling power spectrums and corresponding time series. Note that the SGA fetus (UFCI = 0.39) result visually apparent decrease of fluctuation amplitudes of FHR and UEMG compared to the AGA result. Also, the AGA fetus (UFCI = 0.97) shows a normal pattern dominated by dense coupling, but the SGA fetus shows a high-risk pattern with sparser coupling.

