Figure 4.

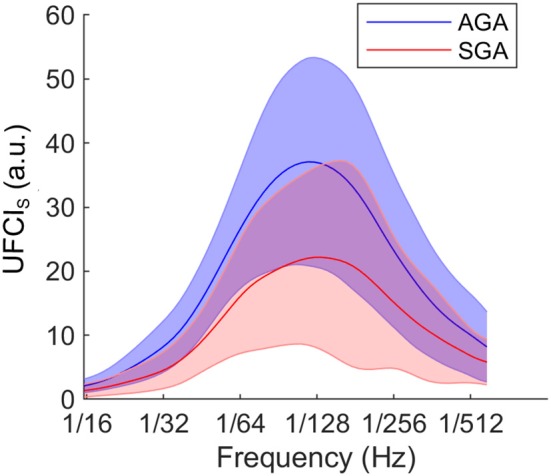
At group level, comparison of UEMG-FHR coupling power at different scales (UFCIS, 1/15–1/600 Hz) between the AGA and the SGA. The solid lines represent the group-averaged values, and the shaded regions denote the standard errors.

At group level, comparison of UEMG-FHR coupling power at different scales (UFCIS, 1/15–1/600 Hz) between the AGA and the SGA. The solid lines represent the group-averaged values, and the shaded regions denote the standard errors.