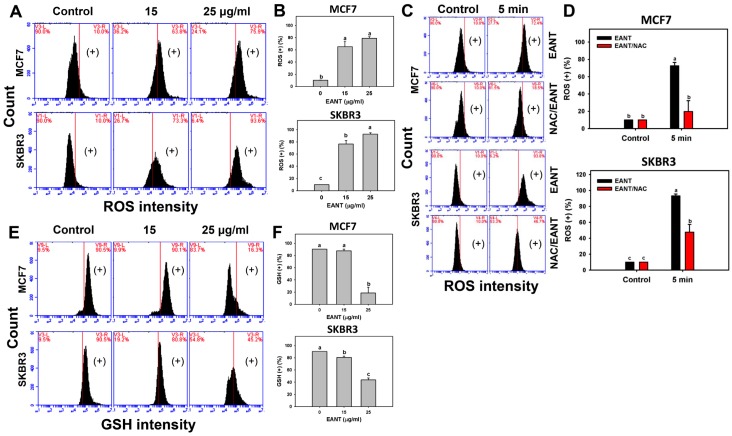
Figure 4.
Reactive oxygen species (ROS) and glutathione (GSH) changes after EANT treatment. (A,B) Concentration effect of EANT on ROS patterns and statistics. Breast cancer cells (MCF7 and SKBR3) were treated with control with DMSO only and EANT (15 and 25 μg/mL) for 5 min. (C,D) Time course effect of EANT on ROS patterns and statistics. Without or with NAC pretreatment, breast cancer cells (MCF7 and SKBR3) were treated with control with DMSO only and 25 μg/mL of EANT for 5 min. (E,F) The concentration effect of EANT on GSH patterns and statistics. Breast cancer cells were treated with control with DMSO only and EANT for 24 h. For each cell line, treatments labeled without the same lower-case letters indicate significant difference. p < 0.05~0.0001. Data, mean ± SD (n = 3). (+) indicates the ROS or GSH (+) population. Positive controls for ROS and GSH were provided in Supplementary Figure S2E–H.

