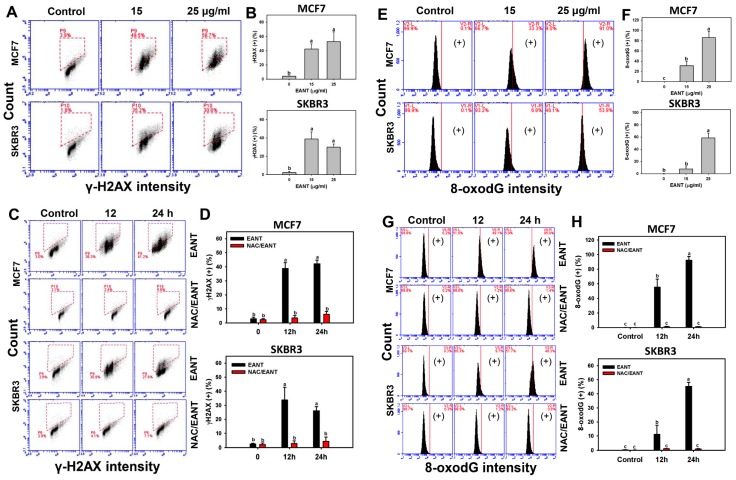
Figure 6.
γH2AX and 8-oxodG changes after EANT treatment. (A,B) The concentration effect of EANT on γH2AX patterns and statistics. Breast cancer cells (MCF7 and SKBR3) were treated with 0 (control with DMSO only), 15, and 25 μg/mL of EANT for 24 h. The dashed box indicates the γH2AX (+) population. (C,D) Time course effect of EANT on γH2AX patterns and statistics. Without or with NAC pretreatment, breast cancer cells (MCF7 and SKBR3) were treated with 25 μg/mL of EANT for 0 (control with DMSO only), 12 and 24 h. (E,F) The concentration effect of EANT on 8-oxodG patterns and statistics. Breast cancer cells (MCF7 and SKBR3) were treated with control with DMSO only and EANT for 24 h. (G,H) Time course effect of EANT on 8-oxodG patterns and statistics. Without or with NAC pretreatment, breast cancer cells (MCF7 and SKBR3) were treated with 25 μg/mL of EANT for 0 (control with DMSO only), 12, and 24 h. For each cell line, treatments labeled without the same lower-case letters indicate significant difference. p < 0.01~0.001. Data, mean ± SD (n = 3). (+) indicates the 8-oxodG (+) population. Positive controls for γH2AX and 8-oxodG were provided in Supplementary Figure S2M–P.

