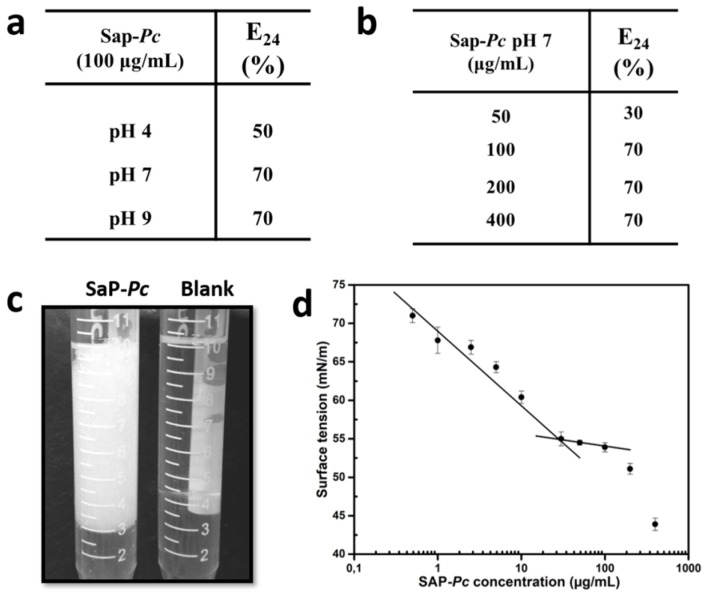
Figure 2.
(a) Table of E24 values of 100 µg/mL of SAP-Pc at different pHs in the presence of Dectol; (b) table of E24 values of SAP-Pc dissolved at pH 7 at different concentrations in the presence of Dectol. All results are averages from three replicate experiments and the standard deviation is less than 10%. (c) Emulsion of 100 µg/mL SAP-Pc in 10 mM phosphate buffer at pH 7 (4 mL) mixed to 6 mL of Dectol after 24 h, in comparison to the mixture of buffer and Dectol, in the absence of the protein. (d) graph of surface tension of SAP-Pc in 10 mM phosphate buffer at pH 7 as function of protein concentration.

