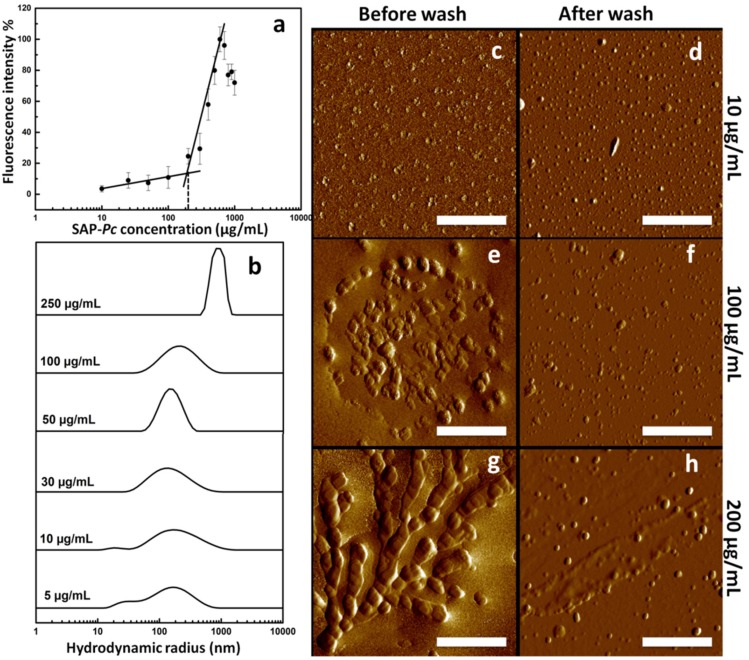
Figure 5.
(a) Fluorescence intensity of SAP-Pc dissolved in 10 mM phosphate buffer at pH 7 at different concentrations in the presence of 30 μM ThT; (b) the averaged-intensity of hydrodynamic size distribution of SAP-Pc dissolved in 10 mM phosphate buffer at pH 7 at different concentrations. (c–g) AFM imaging of 10 (c,d), 100 (e,f), and 200 (g,h) μg/mL, respectively from top to bottom, SAP-Pc in 10 mM phosphate buffer at pH 7. Non-contact mode (NCM) amplitude images of casted samples before (left column) and after washing (right column) (scale bar is 1 μm).

