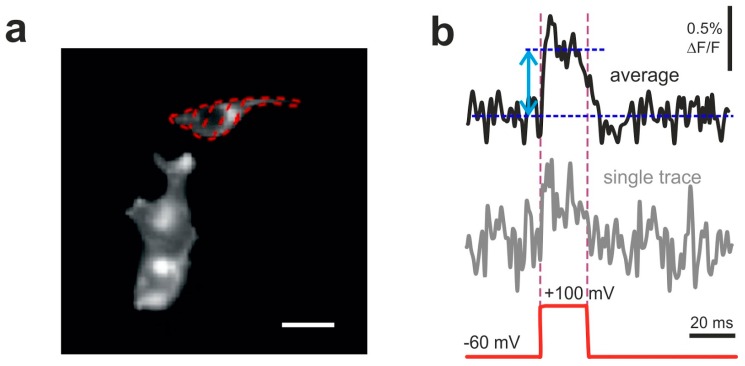
Figure 2.
Examples of optical responses of HEK293T cells transfected with VSD2. (a) Dotted line encircles the analyzed region of interest (ROI). Scale bar: 30 um. (b) Optical traces (obtained from the ROI shown in a) of VSD2 signals evoked by a single voltage step of 160 mV amplitude (bottom red dashed line) repeated 10–20 times with 1 s intervals. Both single trial recording (bottom trace) and average of 10 traces (top bold trace) are shown. Double-headed arrow depicts the amplitude of averaged fluorescence signal measured against the baseline. Signal was recorded at 1 kHz framerate (1 ms exposure per frame).

