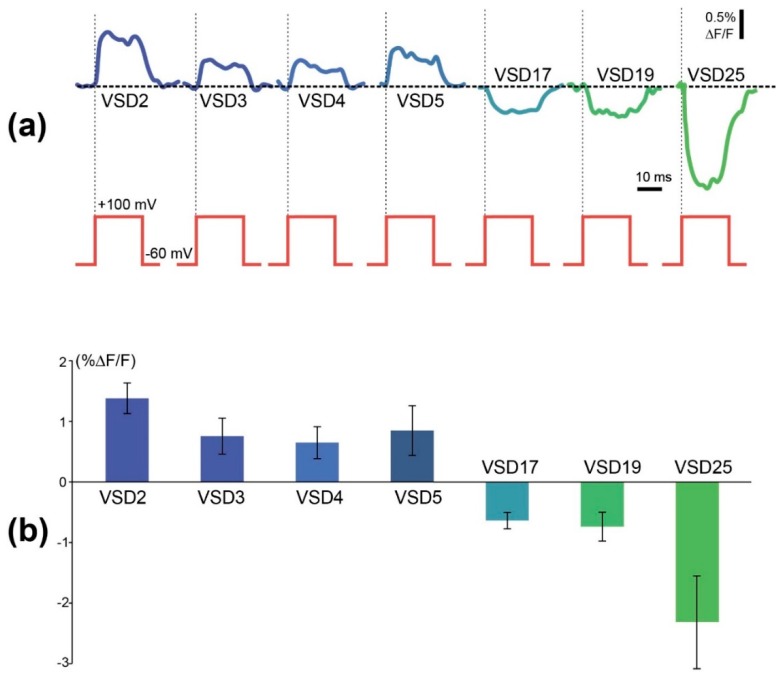
Figure 3.
Comparison of amplitudes of optical responses of 7 different voltage-sensitive probes tested in similar conditions. (a) Examples of traces induced by voltage steps from −60 mV holding potential to +100 mV (upper red steps). Relative change in fluorescence of each probe was plotted below each test step of identical amplitude. Colors of optical traces correspond to the columns on histogram 3b and color-coded the tested probes. (b) Signal amplitudes of the probes measured as mean differences between signal amplitudes and baseline fluorescence of each probe (GEVI) are shown. Each column represents the average of 3–5 experiments +SEM.

