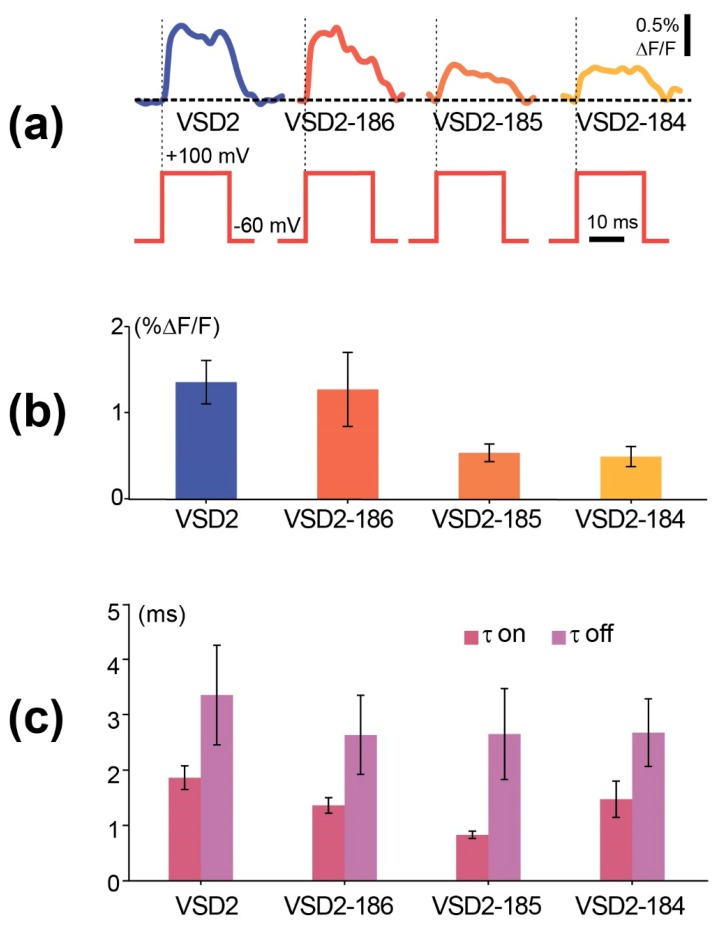
Figure 5.
Functional characterization of GEVI variants in voltage-clamped HEK293 cells. (a) Fluorescence changes (bottom traces) to single voltage steps (top traces) recorded using four different VSDs whose linkers were modified from the C-termini (Supplementary Figure S1). (b) Signal amplitudes ±SEM measured against the baseline at the end of each voltage step. The colours of columns correspond to those of traces shown in (a). (c) Time constants (tau) ±SEM obtained from exponential fits of the ON-responses of the proteins.

