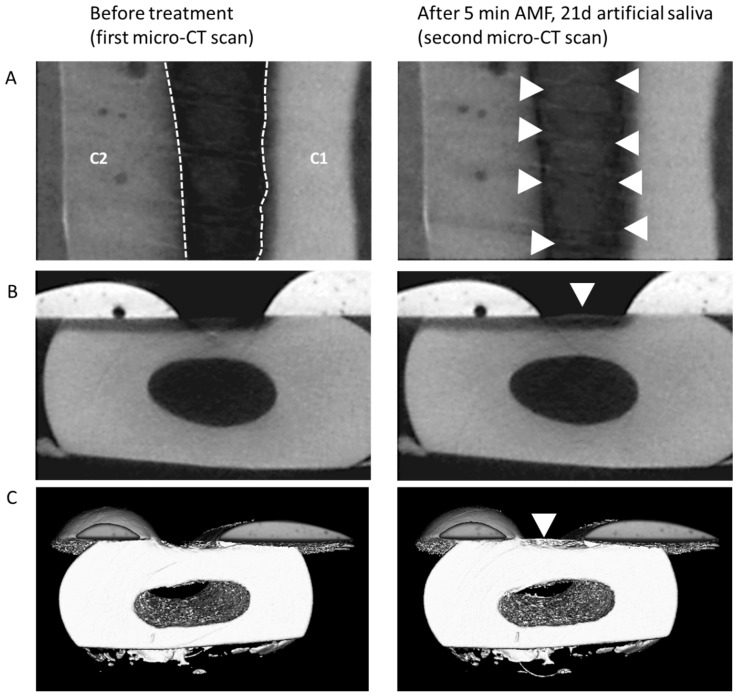
Figure 3.
(A) Example of mineralization differences in a sample before treatment and following the 5 min treatment (shown: AMF) and incubation in artificial saliva for 21 days. Top view of gray scale images; C1/C2: protective composite material (see caption of Figure 4); hatched borders indicate the area of the defect, appearing relatively dark due to the absence of minerals. After treatment (right panel), an increase in mineralization was observed (arrow heads). (B) Side view of the same sample. (C) 3D-reconstruction of registered and segmented datasets of the same sample, with the increase in mineral located within the defect (arrowhead).

