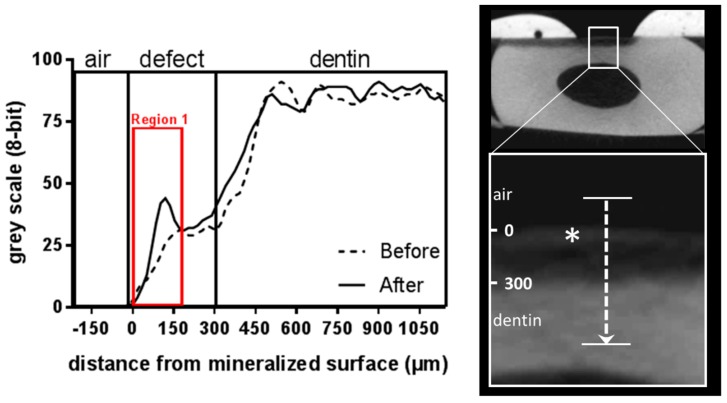
Figure 5.
Gray scale intensity profile measured along a longitudinal axis within “region 1” before and after treatment (shown: EMD). On the right hand, the corresponding gray scale image after treatment is shown. In both the intensity profiles as in the gray scale image the “crust” within the defect is highlighted with an asterisk.

