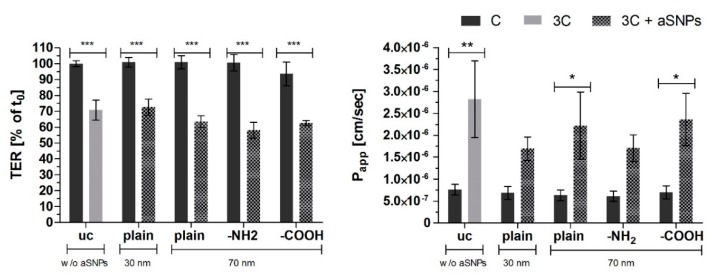
Figure 6.
TER: Transepithelial electrical resistance measurements (% of t0), t0: time point prior to stimulation of each well, respectively; Papp: the apparent permeability coefficient (cm/s)) of NaFlu through the coculture CC (Caco-2/ISO-HAS-1) after stimulation of the inverted coculure CCinc (ISO-HAS-1/Caco-2) with aSNPs and 3C (cytokine mixture ((IL-1β (100 U/mL), TNF-α (600 U/mL) and IFN-γ (200 U/mL)) for 48 h; uc: untreated control (without aSNP and 3C); aSNPs: -plain, 30 nm: Sicastar Red with a diameter of 30 nm, without surface modifications; -plain, -NH2, -COOH, 70 nm: Sicastar Red with a diameter of 70 nm and different surface modifications. All aSNPs were applied in a concentration of 100 µg/mL. Data are depicted as means ± SE of three independent experiments with n = 3. For statistical analysis one-way ANOVA with Dunnett’s Multiple Comparison test was conducted. * p < 0.05, ** p < 0.01, *** p < 0.001.

