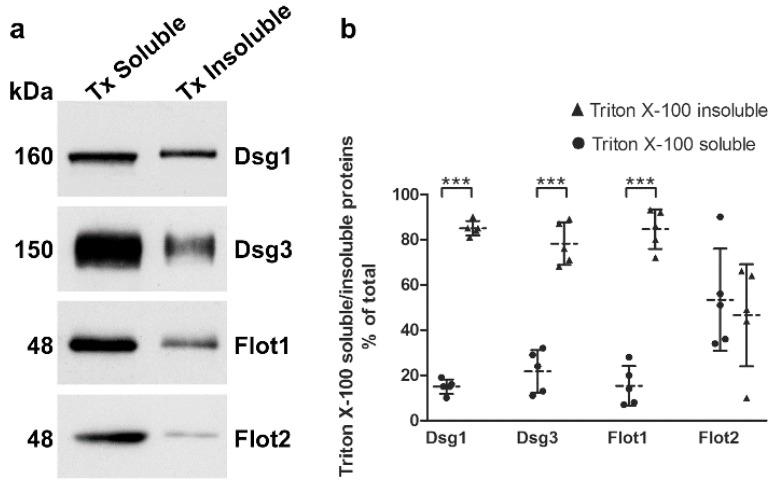
Figure 6.
Detergent solubility of desmogleins and flotillins in hTert cells. The cells were grown in KGM with 2 mM calcium for 24 h and a sequential detergent extraction was performed, resulting in two pools with detergent soluble and insoluble proteins. (a) Western blot analysis of these fractions was used to detect Dsg1, Dsg3, Flot1 and Flot2; (b) quantification of the gel bands was performed with the Quantity-One software, and the percentage of the total cellular protein was calculated taking into account that triton X-100 (TX) soluble bands represent a higher relative percentage of the respective fraction than the TX insoluble bands. For statistical analysis, unpaired Student’s t-test was used. Statistically significant differences are indicated by *** p < 0.001. n = 5 independent experiments. Dotted line: Mean of samples, solid lines: SD.

