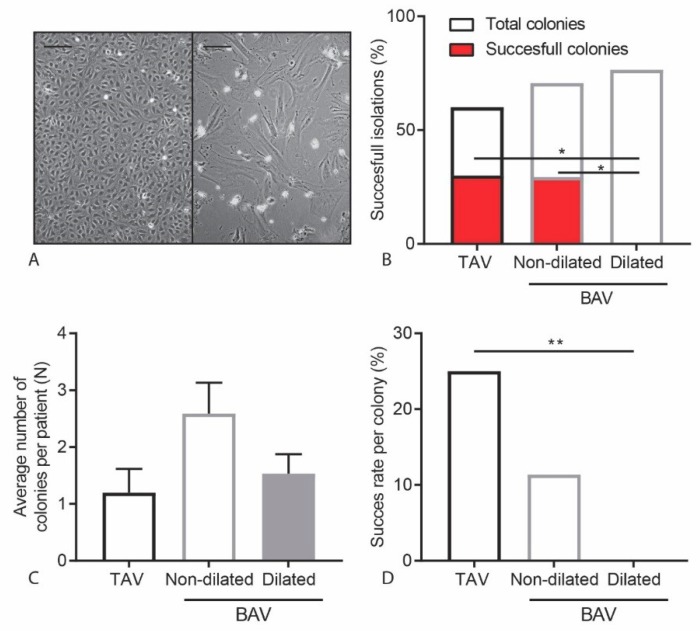
Figure 1.
Successful growth of ECFCs in TAV and BAV non-dilated patients. (A) Representative images of a successful (left) and an unsuccessful (right) ECFC colony. Scalebar is 200 µm. (B) Graph showing the percentage of patient isolations resulting in a colony and the percentage of patient isolations resulting in a cell line. (C) Graph indicating the average number of colonies per isolation. (D) Graph showing the percentage of colonies resulting in a successful ECFC cell line. * p < 0.05, ** p < 0.01.

