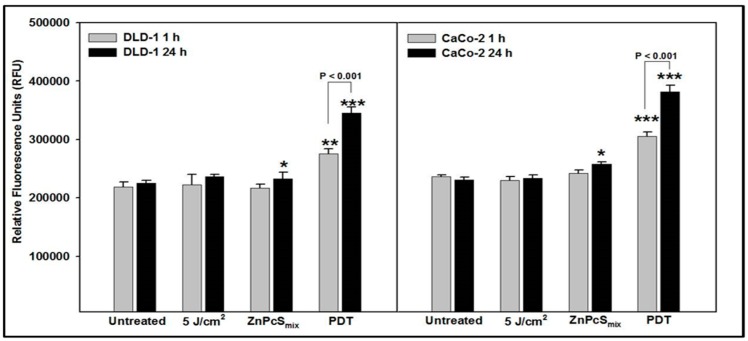
Figure 1.
Hydrogen peroxide (H2O2) was determined after 1 and 24 h post-treatment and relative fluorescence units were measured (530Ex/590Em). Significant differences as compared to untreated control cells is shown as * p < 0.05, ** p < 0.01 and *** p < 0.001. There were significantly increased H2O2 levels in PDT treated DLD-1 and Caco-2 cells after both 1 and 24 h incubation.

