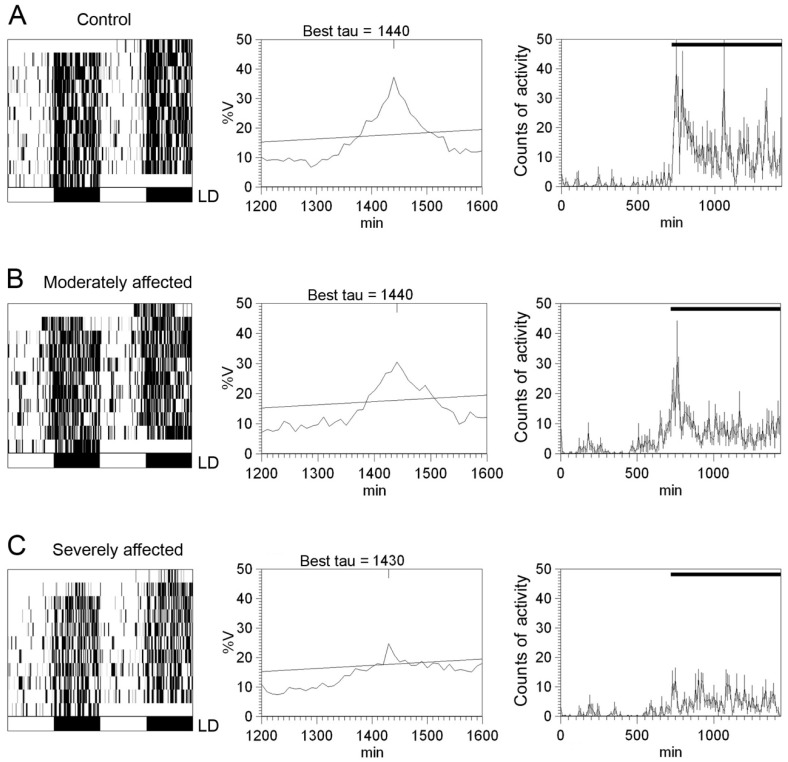
Figure 7.
Circadian rhythms of locomotor activity in rotenone-induced Parkinsonian rats: (A–C) Representative locomotor activity actograms (left panels), periodograms (middle panels), and mean waveforms (right panels) for a control animal (A), an animal moderately affected by rotenone (B), and an animal severely affected by rotenone (C) exposed to a 12:12 LD cycle. Light and dark schedules are represented by white and dark bars, respectively. (Modified from Lax et al., 2012) [134].

