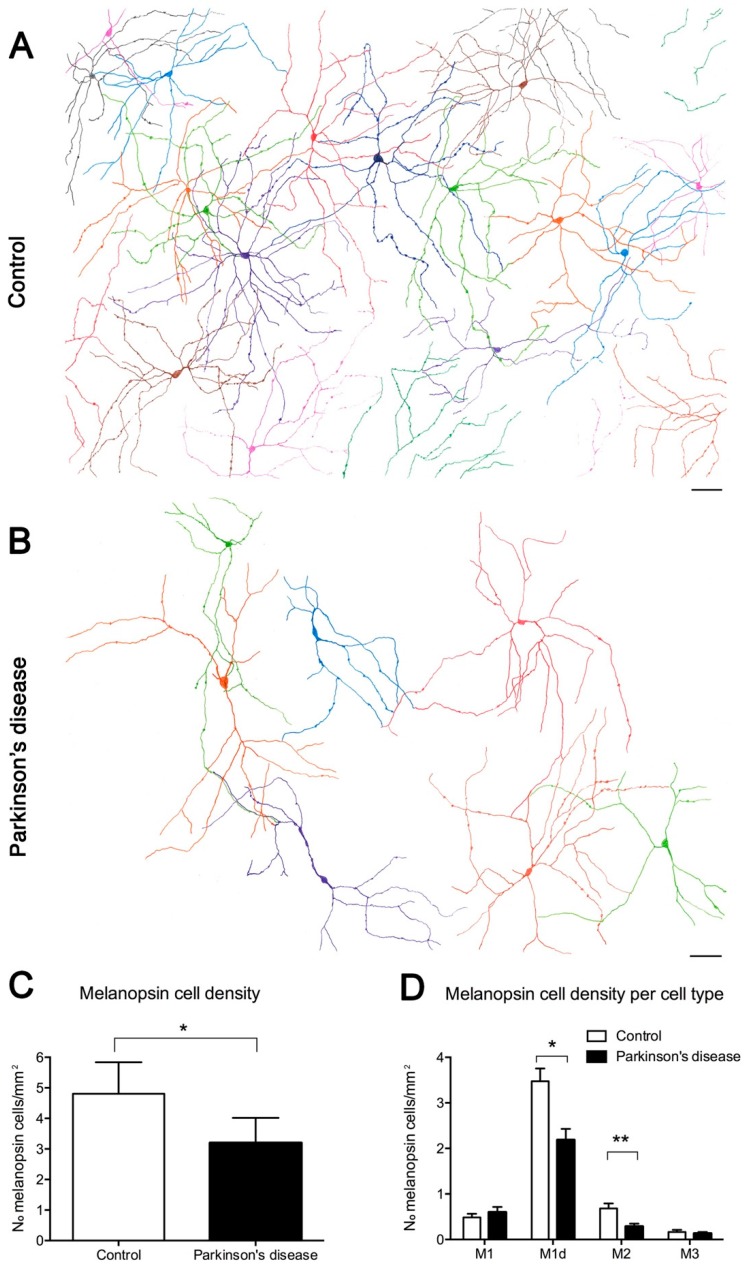
Figure 8.
Melanopsin ganglion cells in Parkinson’s disease (PD): (A–B) Representative drawings of control and PD retinal fields. (A) Melanopsin plexus in a control wholemount retina. (B) Melanopsin plexus in a PD wholemount retina. Each color defines an individual mRGC. (C) Total mRGC quantification (number of mRGCs per mm2) and comparison between control and PD subjects. (D) Comparison of the mRGC density per cell type in control and PD subjects. Scale bar, 100 μm. (Modified from Ortuño-Lizarán et al., 2018) [42].

