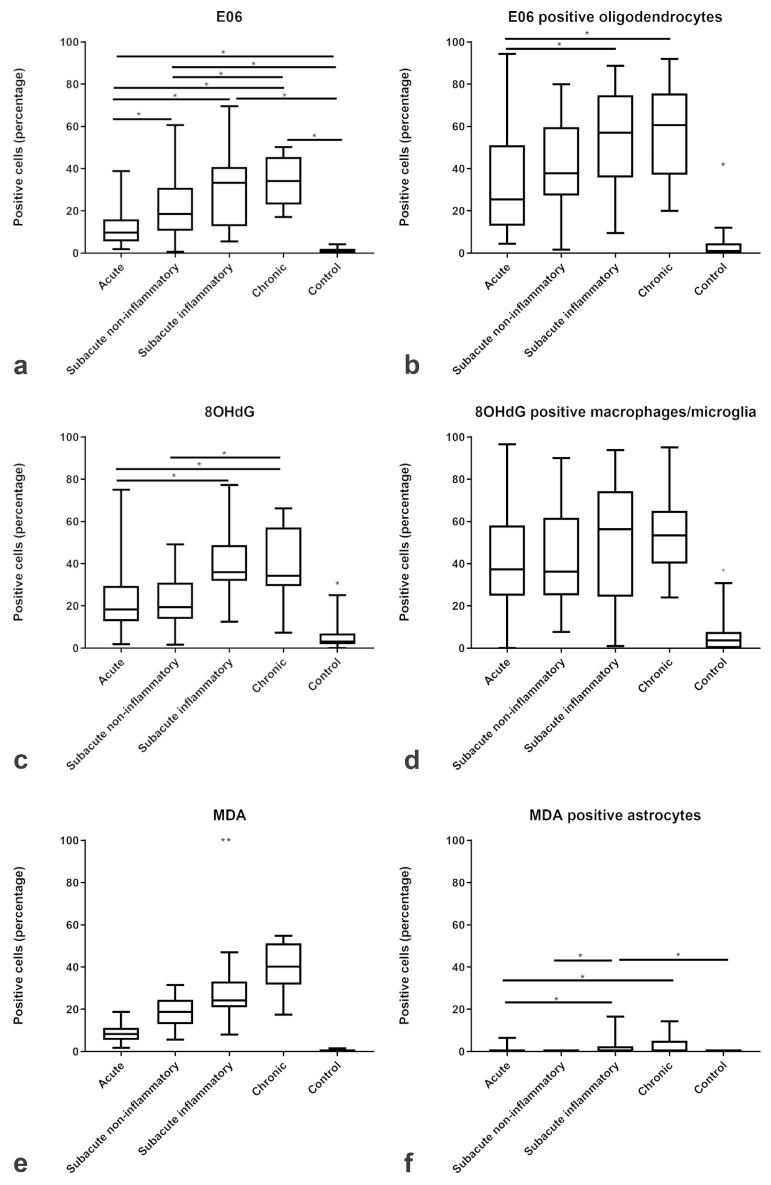
Figure 3.
Relative changes in the proportions of cells immunopositive for ROS-products. The box plots show increasing percentages of positive cells for (a) oxidized phospholipids (clone E06), (c) 8-OHdG/8-OHG, and (e) MDA and the percentage of positive (b) oligodendrocytes, (d) macrophages/microglia and (f) astrocytes positive for ROS products in acute, subacute non-inflammatory, subacute inflammatory, and chronic CDV-DL lesions as compared to controls. Significant differences between the groups as revealed by the Kruskal–Wallis test with independent pairwise post-hoc Mann–Whitney U-test are marked with an asterisk (* p ≤ 0.05, ** p ≤ 0.005).

