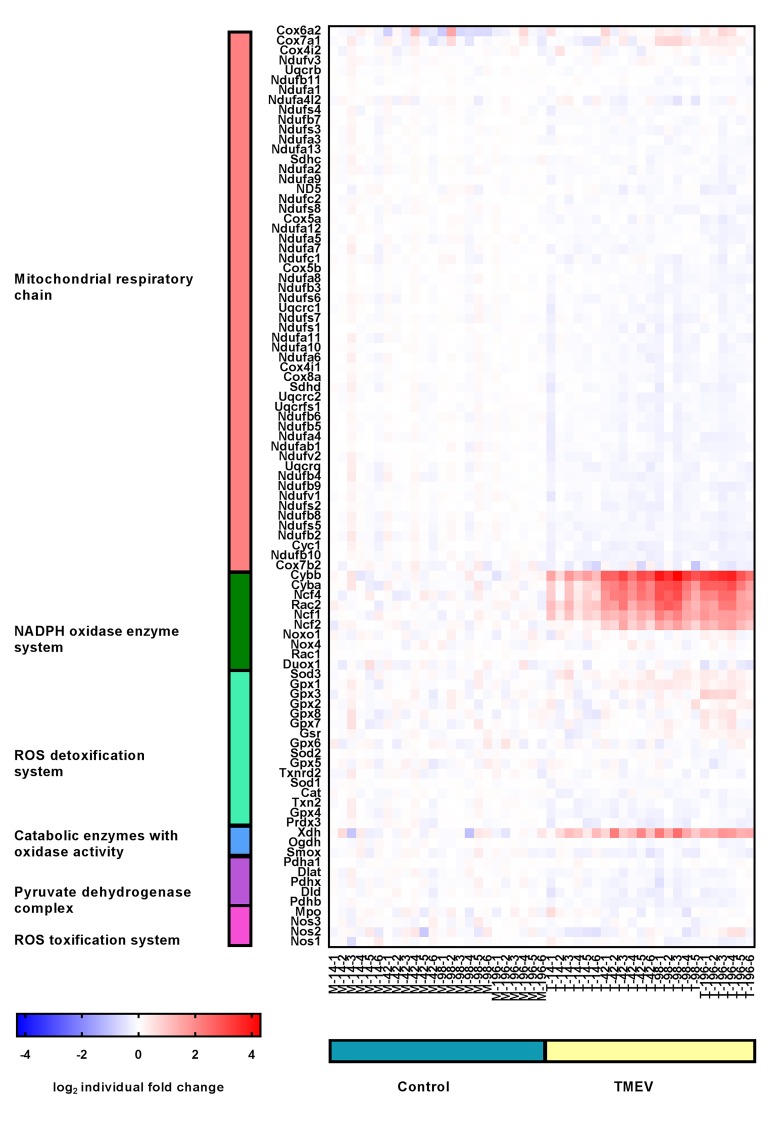
Figure 10.
Expression profile of manually selected marker genes (rows) functionally related to mitochondrial respiratory chain (red), NADPH oxidase enzyme system (green), ROS detoxification system (mint), catabolic enzymes with oxidase activity (blue), pyruvate dehydrogenase complex (purple) and ROS toxification system (pink) in the spinal cord (columns) of controls (blue) and TMEV infected mice (brown). Note that the most prominent changes in gene expression are upregulations of genes of the NADPH oxidase enzyme system affecting TMEV infected mice. The heatmap displays the log2-transformed individual fold changes relative to the mean expression of the controls indicated by a color scale ranging from −4 (16-fold downregulation) in blue to 4 (16-fold upregulation) in red.

