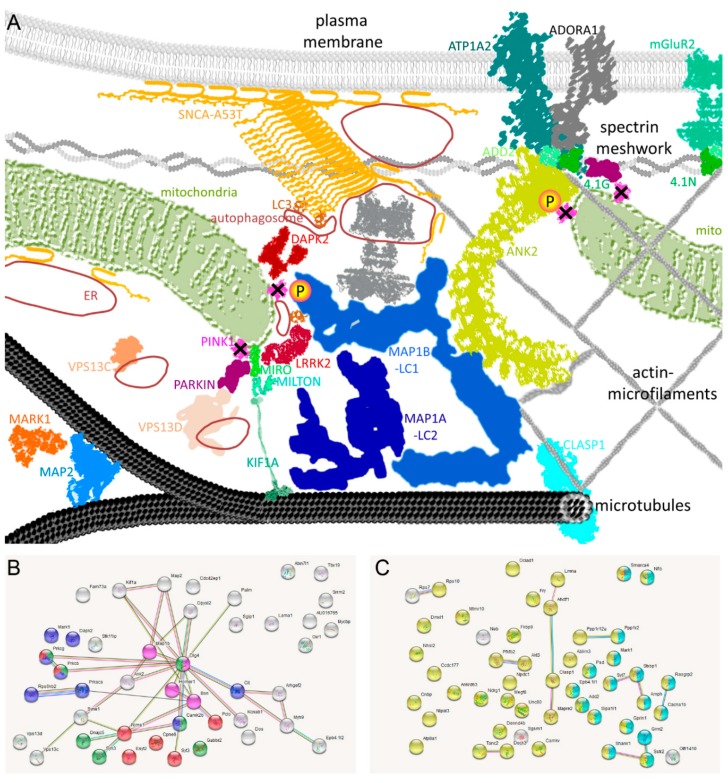
Figure 3.
(A) Schematic representation of dysregulated factors, based on their subcellular localization and on textmining about functional interaction effects. Three cytoskeletal layers underlying neuronal plasma membranes (microtubules, actin-microfilaments, spectrin meshwork) are shown, which provide correct localization to mitochondria, vesicles, and the membrane channels/pumps. The overexpressed mutant A53T-SNCA with its aggregates, the deleted PINK1 kinase, and the downstream proteins affected by altered phosphorylation—and LRRK2 as a DAPK2 homologous kinase that phosphorylates MAP1B in abnormal manner in the PARK8 variant of PD—are visualized as colored symbols, reminiscent of their known 3D structures and with rough representation of their size differences. The two strongest deficits in phosphorylation are highlighted in pink/yellow circles. (B) As additional automated scheme on protein–protein interactions and pathway enrichments, search tool for the retrieval of interacting genes (STRING) diagrams are provided for all 45 factors with reduced Ser/Thr-phosphorylation and (C) 49 factors with increased Ser/Thr-phosphorylation. The protein–protein enrichment p-value was very significant among the downregulations (p = 7.54 × 10⁻¹²), but barely significant among the downregulations (p = 0.036). Previous knowledge of the interaction between these factors from experiments, co-expression, or text mining is illustrated by connecting lines of various colors.

