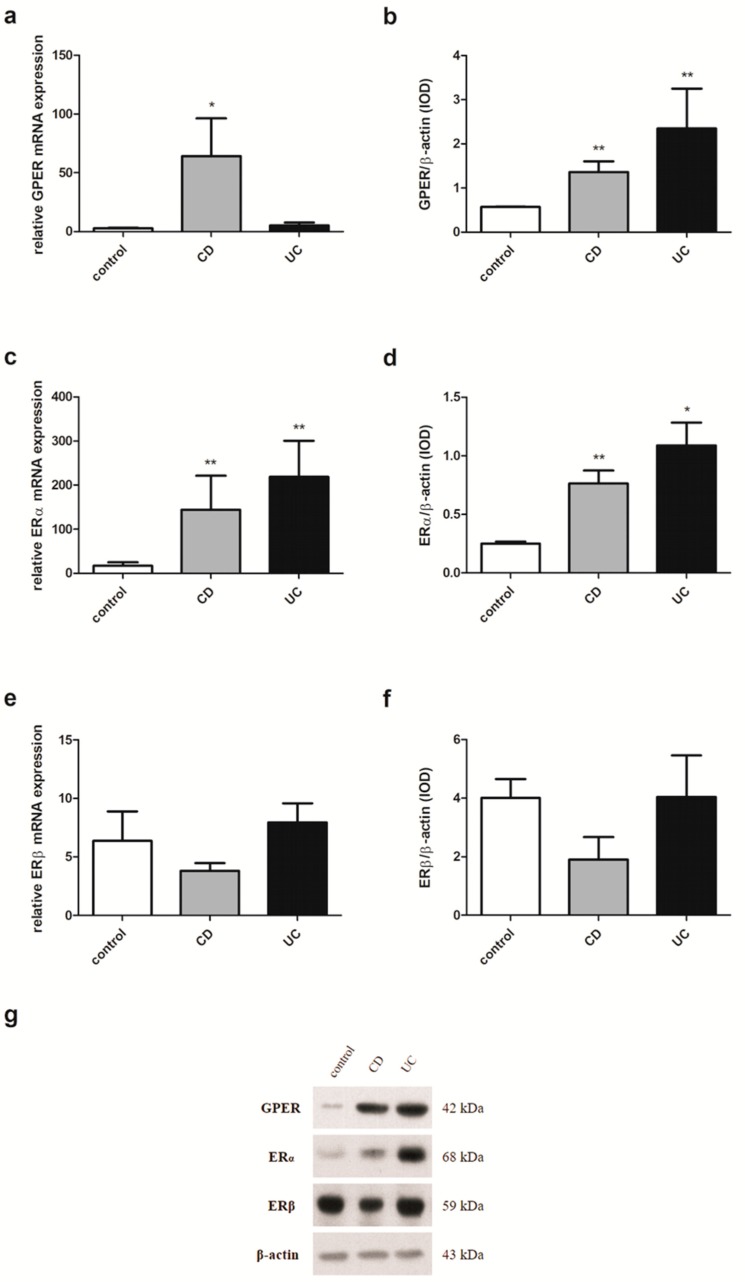
Figure 4.
Expression of GPER (a,b), ERα (c,d) and ERβ (e,f) at the mRNA (a,c,e) and protein level (b,d,f) in males with CD and UC and related controls (control, n = 12; CD, n = 19; UC, n = 24). Representative immunoblots of GPER, ERα and ERβ (g). Values are means ± SEM; * P < 0.05, ** P < 0.01 vs. control.

