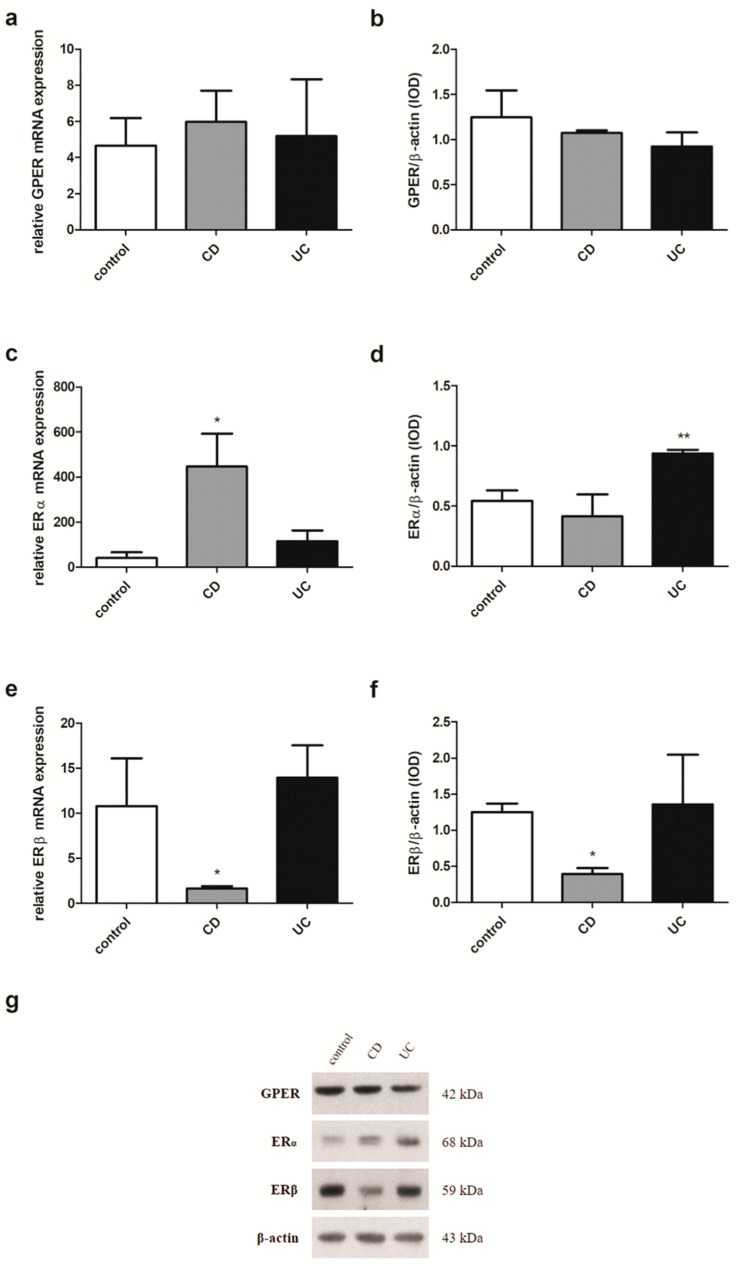
Figure 6.
Expression of GPER (a,b), ERα (c,d) and ERβ (e,f) at the mRNA (a,c,e) and protein level (b,d,f) in females with CD and UC over the age of 50 years and related controls (control, n = 10; CD, n = 5; UC, n = 6). Representative immunoblots of GPER, ERα and ERβ (g). Values are means ± SEM; * P < 0.05, ** P < 0.01 vs. control.

