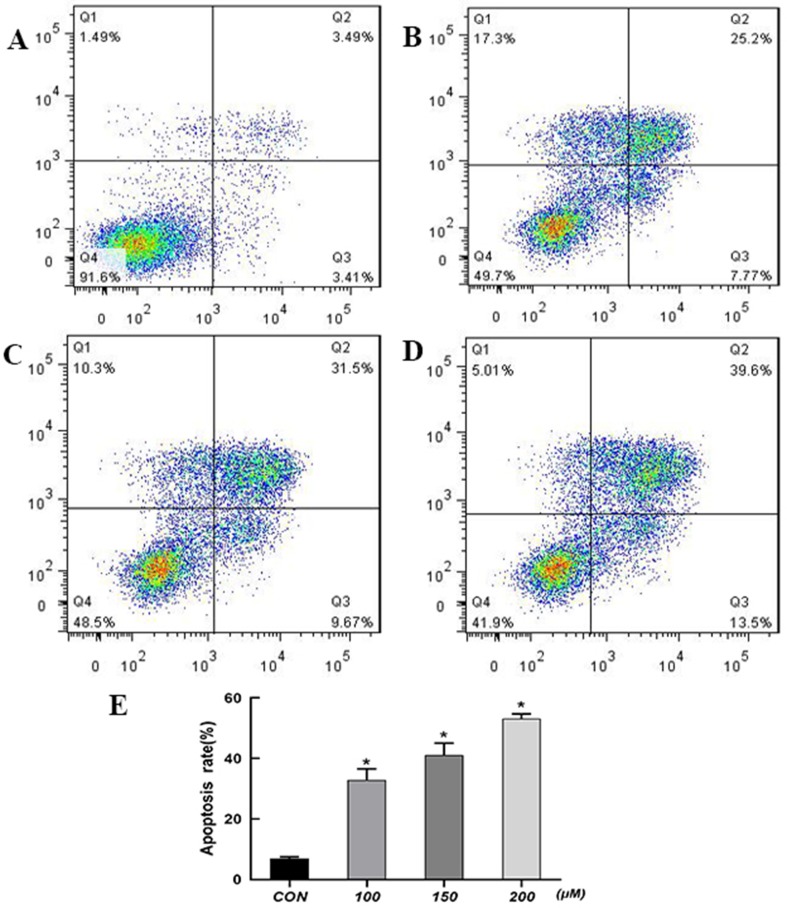
Figure 2.
Effect of QUE at different concentrations on apoptosis of HCT116 cells as detected by flow cytometry. (A) Control; (B) 100 µM; (C) 150 µM; (D) 200 µM. (E) The percentage of apoptotic cells was presented as the mean ± SD of three independent experiments, *P < 0.05 vs. control; one-way ANOVA, followed by Dunnett’s post hoc test. Abbreviations: QUE, quercetin; CON, control.

