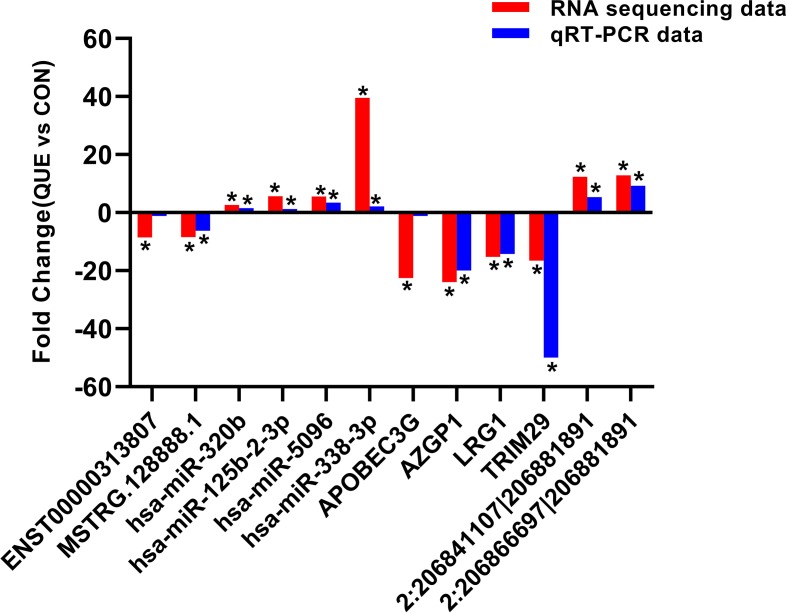
Figure 5.
The differential expression of ncRNAs and mRNAs was validated by quantitative real-time PCR (qRT-PCR). The data showed that the expression levels of the hsa-miR-125b-2-3p, hsa-miR-338-3p, hsa-miR-320b, hsa-miR-5096, circRNA 2:206841107|206881891, and circRNA 2:206866697|206881891 were up-regulated and that the LRG1, AZGP1, TRIM29, APOBEC3, lncRNA ENST00000313807, and lncRNA MSTRG.128888.1 were down-regulated in QUE-treated HCT116 cells relative to the HCT116 cells. The heights of the columns in the chart represent fold change. The qRT-PCR results were consistent with the RNA sequencing data. *P < 0.05, QUE vs. CON. QUE represents HCT-116 cells treated with QUE. CON represents untreated HCT-116 cells. Abbreviations: QUE, quercetin. CON, control.

