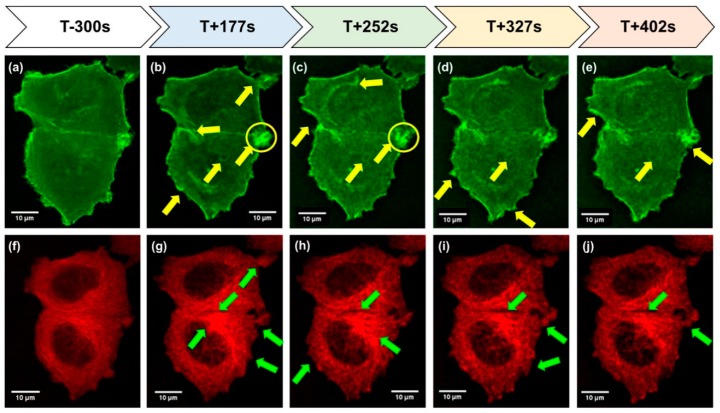
Figure 1.
Time course and images of FLUMIAS on TEXUS 54 (40×/1.2). The MCF-7 breast cancer cells 5 min before launch (T-300 s) of the rocket and during the r-μg phase (T + 177s–T + 402s). The yellow arrows show the changes in F-actin (a–e; green fluorescence). The yellow circles include an area with F-actin accumulations. Filopodia and lamellipodia are found after 150s, which are more pronounced with time. The green arrows indicate changes in α-tubulin (f–j; red fluorescence). The tubulin network reveals holes after 150s and a looser structure.

