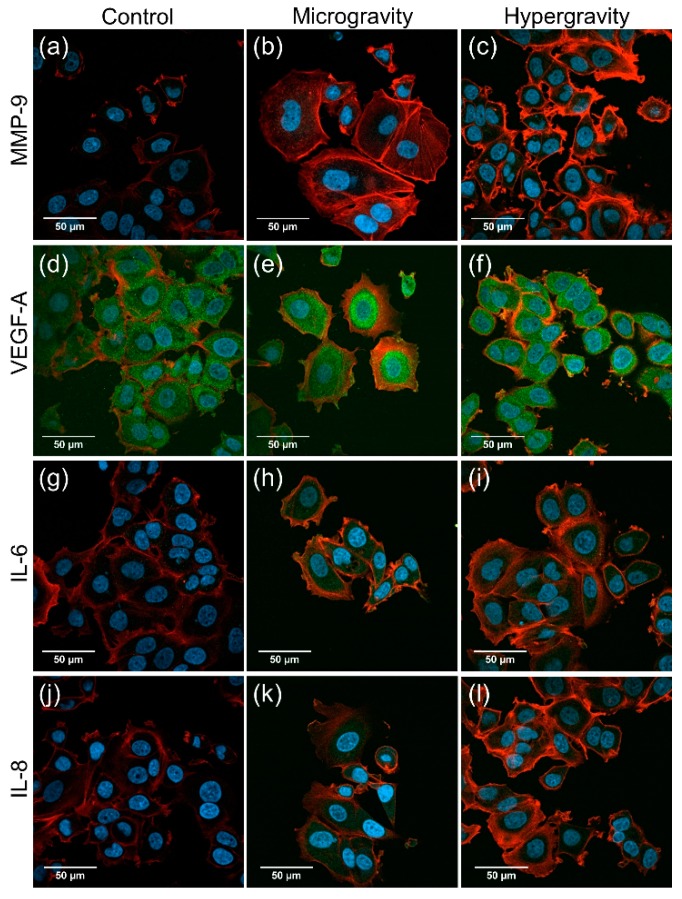
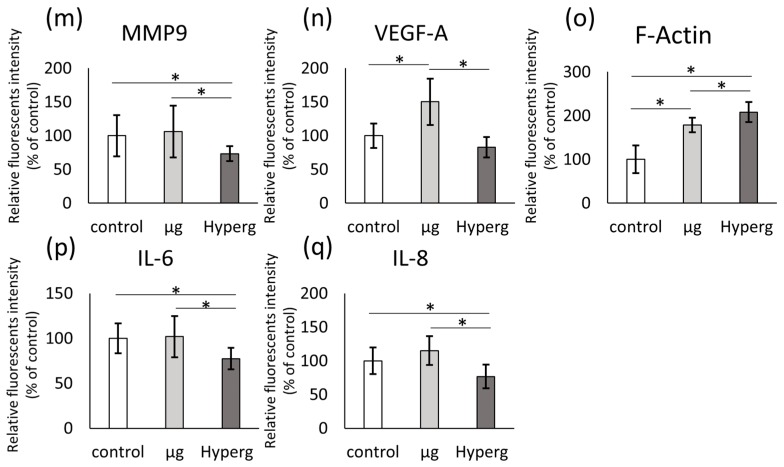
Figure 2.
Indirect immunofluorescence staining of PFA-fixed cells from the TEXUS 54 sounding rocket mission. 2500 MCF-7 cells were seeded into each well of the 18 well Ibidi slides. The cells were fixed either at the end of the hyper-g period or at the end of the µg period. The two conditions were compared to 1g-ground control samples. The confocal laser scanning microscopy images (a–l) show either MMP9, VEGF-A, IL-6 or IL-8 in green, DAPI (in blue) and F-Actin (in red). Scale bar is equal to 50 µm. The intensity of the staining was quantified by ImageJ (m–q). All data are shown as mean ± SD, n = 10–14, with significance indicated by * p < 0.05.


