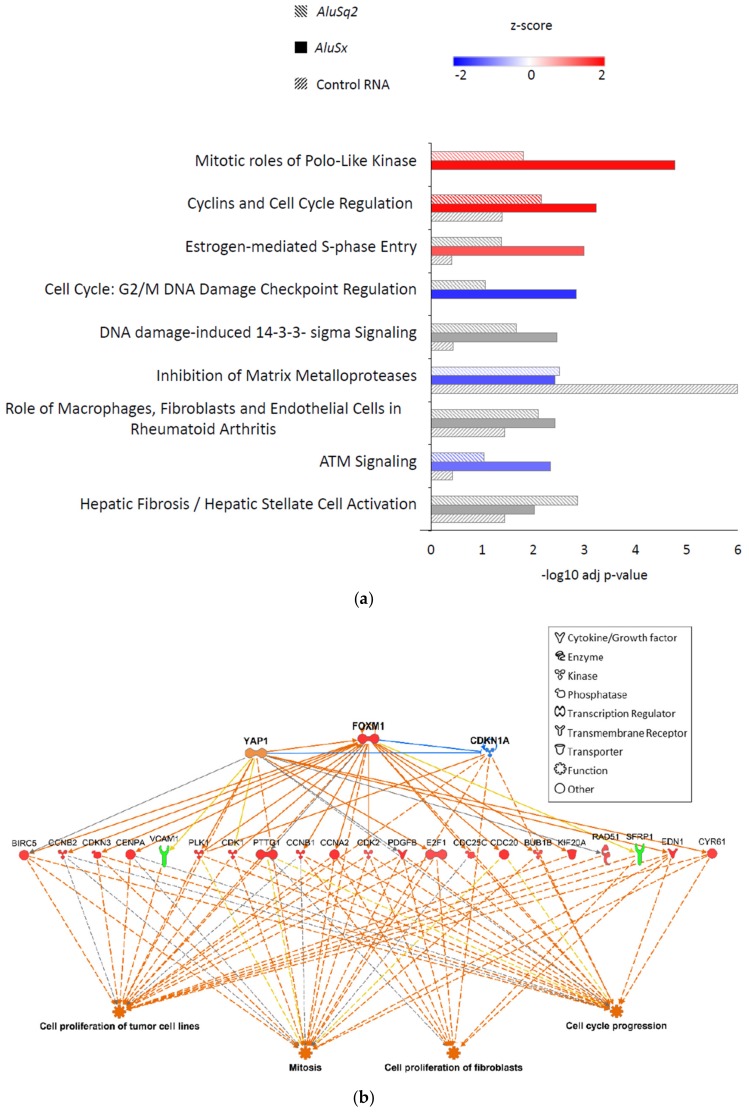
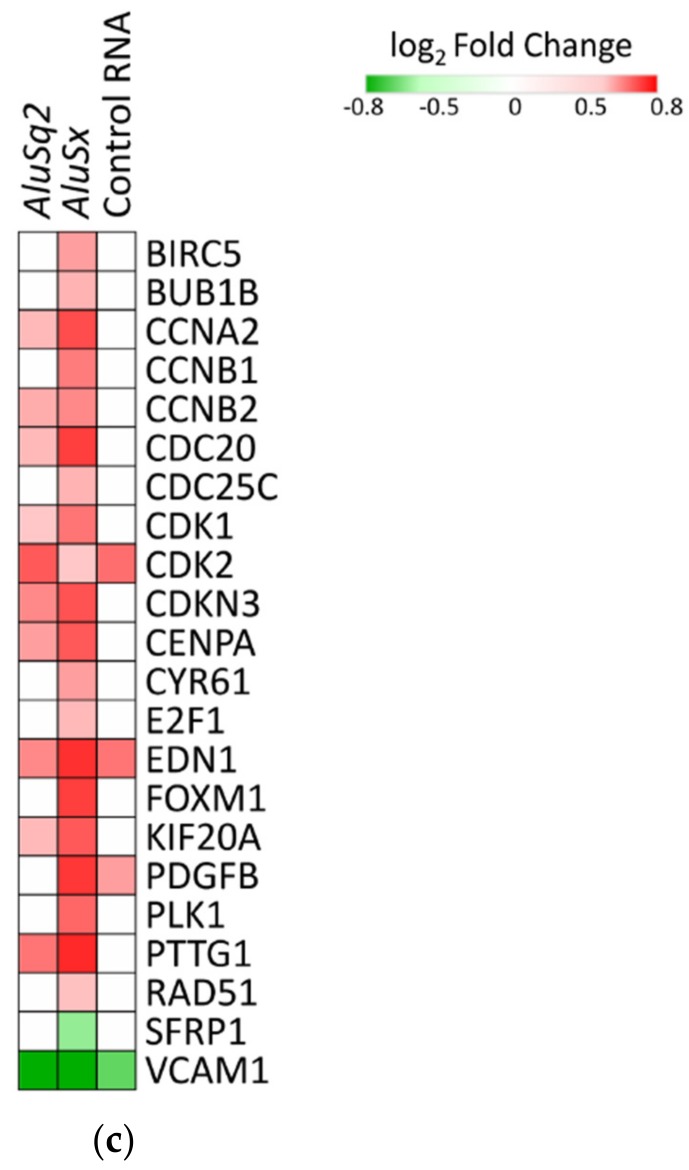
Figure 5.
Dysregulation of cell cycle genes in Alu-overexpressing fibroblasts. (a) Pathways enriched in differential transcriptomes of AluSq2, AluSx, and Control RNA transformed fibroblasts as revealed by IPA analysis. Only pathways with p-value (BH correction) <0.01 in at least one comparison are shown and are ordered by AluSx vs. empty vector p-value. Z-score for activated or inhibited pathways is shown in red or blue, respectively. Grey bars: no predictions can be made. (b) Prediction of the upstream regulators that could modulate the expression of differentially expressed genes in AluSx-overexpressing fibroblasts and their effect on cell functions. Dysregulated genes are shown in the middle row as upregulated genes (red symbols) and downregulated genes (green symbols). Regulators are shown in the upper part of the figure. Blue indicates a predicted inhibition of the protein activity, while orange indicates a predicted activation. Blue lines indicate an inhibitory relationship, orange lines show an activating relationship, yellow lines indicate inconsistent relationship, while gray lines stand for no predicted effect. Continuous lines show direct interactions and dashed lines show indirect interactions (less than three passages). (c) Heatmap of differentially expressed genes shown in (b).


