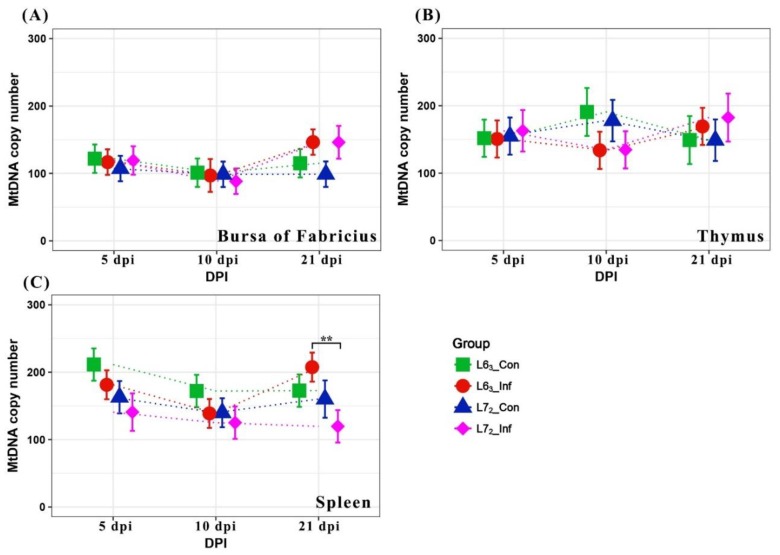
Figure 1.
The mitochondrial DNA (mtDNA) copy number variation (means ± standard error) over three time-points. (A), (B) and (C) show the mtDNA abundance in bursa of Fabricius, thymus, and spleen, respectively. MtDNA copies per cell were generated with ND2 and β-actin qPCR data. Birds used in each group were five. The symbols * and ** indicate statistical significance at p ≤ 0.05 and p ≤ 0.01 levels, respectively, between lines or treatment groups.

