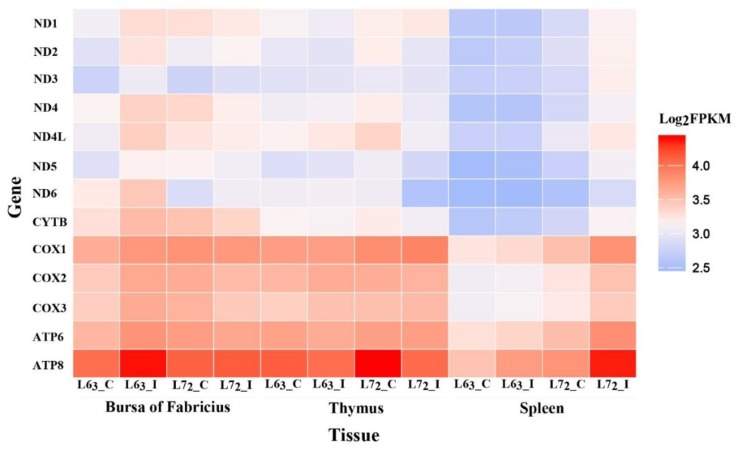
Figure 2.
The expression of the 13 mtDNA protein coding genes. The average fragments per kilobase of transcript per million (FPKM) value of the two replicates was used as the gene expression and the heatmap was plotted based on log2FPKM. Each row represents an individual gene and each column represents the tissue and group type. The color legend represents the characteristic level, with red indicating high expression level and the blue indicating low expression level. Color density indicates different range of Log2FPKM.

