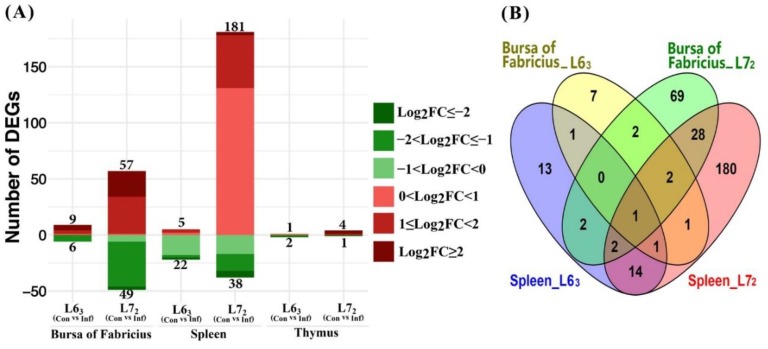
Figure 3.
Differentially expressed mitochondria-related nuclear genes in response to Marek’s disease virus (MDV) challenge (FDR ≤ 0.1). (A) Number of up- or down-regulated DEGs in three lymphoid organs. Up-regulated and down-regulated genes are displayed in red and green color, separately. Color density indicates different range of Log2 (fold change) (log2FC). (B) Venn diagram showing the number of overlapped DEGs in bursa of Fabricius and spleen from line 63 and 72.

