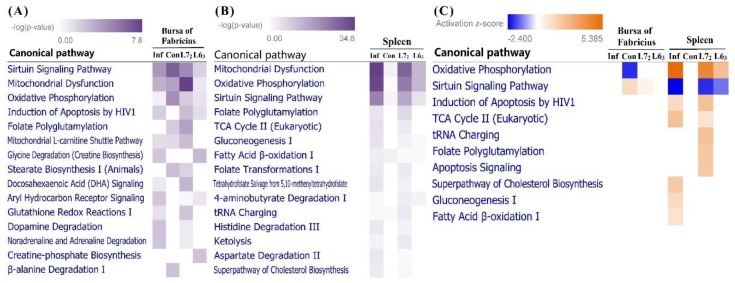
Figure 5.
Ingenuity Pathway Analysis (IPA). (A) Top 15 canonical pathways based on the DEGs in bursa of Fabricius. (B) Top 15 canonical pathways based on the DEGs in spleen. (C) The canonical pathways with absolute z-score ≥1 in bursa and spleen. Pathways are sorted by p-value or absolute z-score, and the intensity of colors indicates the higher or lower value.

