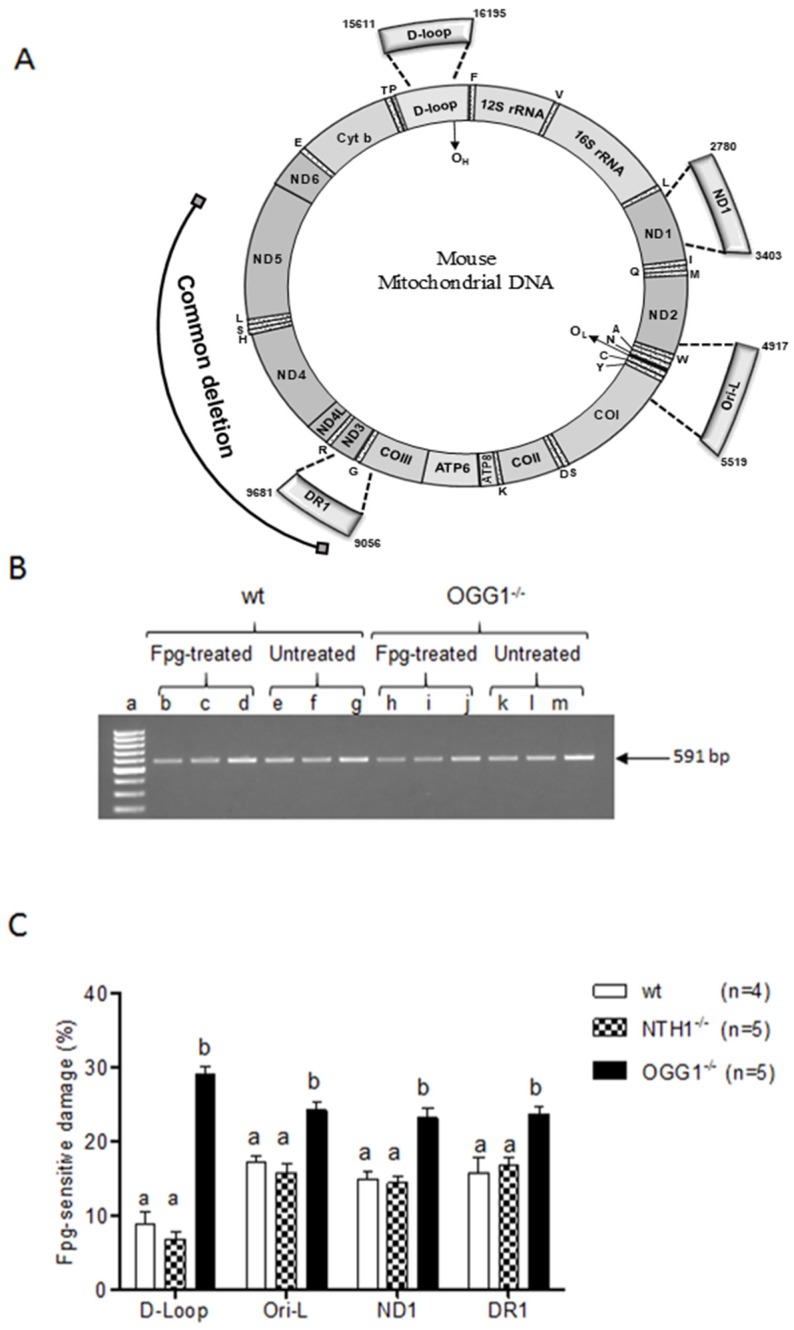
Figure 3.
Analysis of purine-specific mtDNA damage at the d-loop, Ori-l, ND1, and direct repeat 1 (DR1) regions in liver from wt, NTH1−/−, and OGG1−/− mice. (A) Map of mouse mtDNA. The thick arches extending out of the circle represent the four amplified regions tested for formamidopyrimidine DNA glycosylase (Fpg) sensitivity delimited, respectively, by the primer pairs listed in Table 2, and corresponding to the indicated nucleotides. Numbering is according to National Center for Biotechnology Information (NCBI) accession number NC_005089.1. The outmost arch represents the 3.8-kb deletion, delimited by direct repeat 1 (DR1) and direct repeat 2 (DR2) represented by two full squares. (B) representative gel analysis of amplicons from Fpg-treated and untreated total DNA from one wt and one OGG1−/− mouse (the target was the d-loop region). An aliquot (5 μL) of each PCR reaction was loaded onto a 1.5% agarose ethidium bromide-stained gel and analyzed for band intensities. Lane loading was as follows: a = GeneRuler 100-bp DNA ladder (Thermo Fisher Scientific Inc, Waltham, MA, USA); b, c, e, f, h, i, k, and l = 5 ng of total DNA as template; d, g, j, and m = 7.5 ng of total DNA as template. (C) Bars represent the mean and SEM of the ratio between Fpg-treated and untreated band intensities, expressed as the percentage of the complement to 100 to improve the graphical evaluation. Statistical difference determined by the Kruskal–Wallis test with Dunn’s multiple comparison test. Bars not sharing a common superscript letter differ significantly (p < 0.05).

