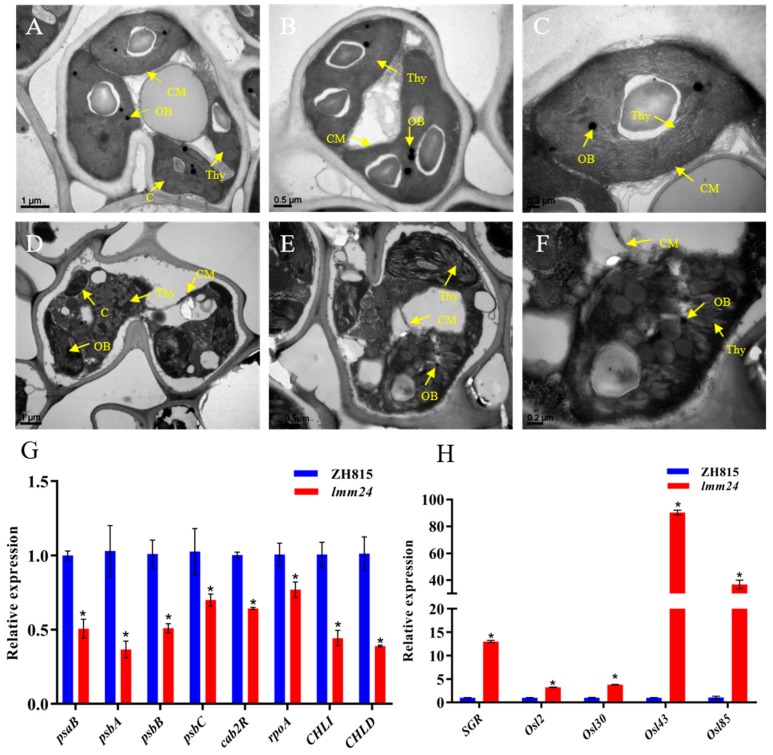
Figure 3.
Qualitative TEM observation and genes expression analysis. (A–C) Observation of chloroplasts in ZH8015 mesophyll cells by TEM. C: chloroplast; Thy: thylakoid lamellae; OB: osmiophilic body; CM: chloroplast membrane. (D–F) Observation of chloroplasts in lmm24. (G) Expression levels of photosynthesis-related genes. β-actin1 as a reference gene. (H) Expression levels of SGR gene and senescence-associated genes, β-actin1 as a reference gene. The expression level of each gene in ZH8015 was normalized to 1. Data are means ± SE of three biological replicates. The p-value is calculated by the Mann–Whitney U test method. *p < 0.01.

