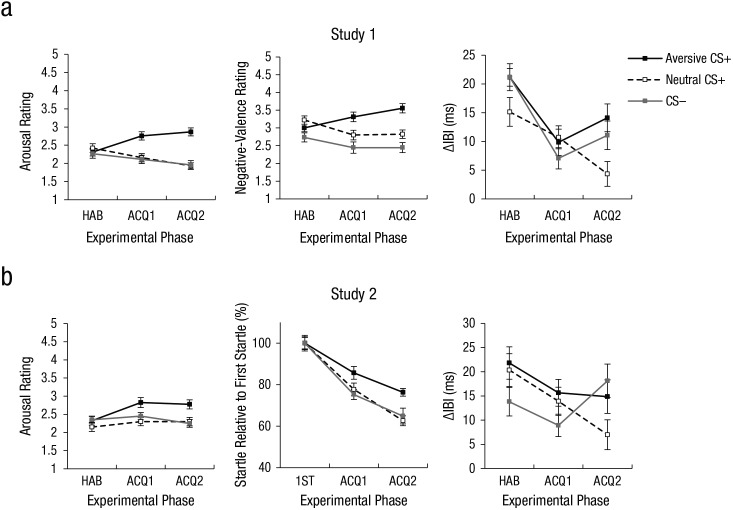
Fig. 4.
Responses to conditioned stimuli (CSs). Mean arousal rating, negative-valence rating, and CS-evoked interbeat interval (IBI) in Study 1 are shown in the top row, and mean arousal rating, startle response, and CS-evoked IBI in Study 2 are shown in the bottom row. Startle response was normalized relative to the first startle response during acquisition. In all graphs, results are shown for each CS type during three phases: habituation (HAB), first acquisition block (ACQ1), and second acquisition block (ACQ2). CS-evoked IBIs are shown only for the deceleration time window (D1). Error bars show repeated measures standard errors of the mean (Masson & Loftus, 2003).

