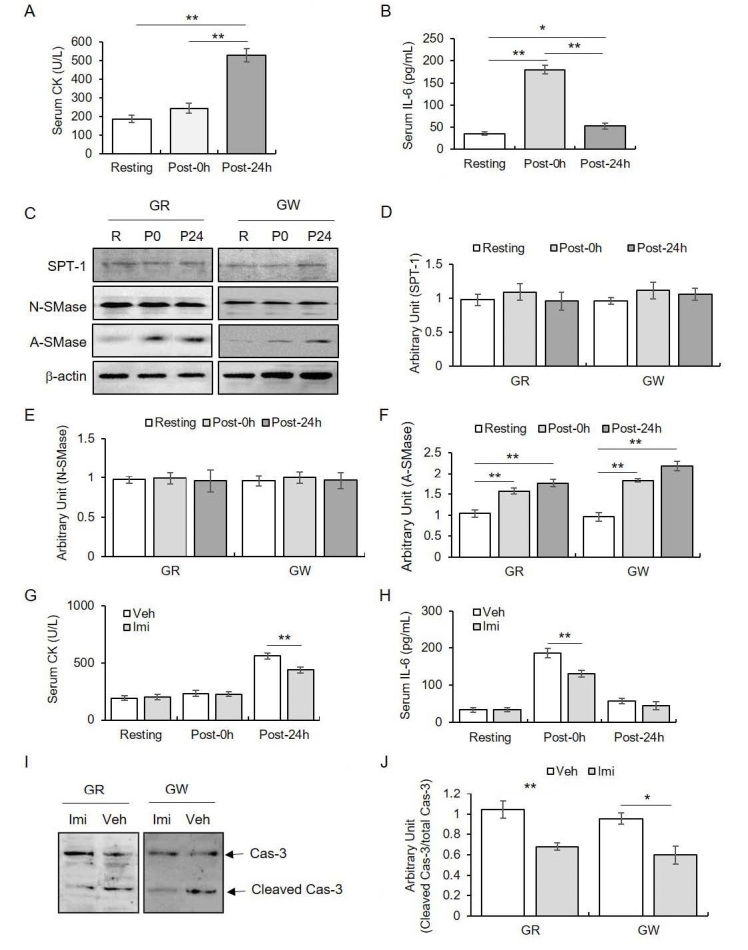
Figure 1. The effect(s) of sphingolipid metabolism on exercise-induced muscle damage.

The quantitative analysis of serum (A) CK levels and (B) IL-8 levels in response to strenuous treadmill running, (C) representative images of western blot for SPT-1, N-SMase, and A-SMase. The quantitative analysis of (D) SPT-1, (E) N-SMase, and (F) A-SMase. The quantitative analysis of serum (G) CK levels and (H) IL-6 levels based on imipramine in response to strenuous treadmill running. Representative images of western blot for (I) caspase-3 and the quantitative analysis of (J) caspase-3. Data are presented as mean ± SE. * and ** denote p < 0.05 and p < 0.01, respectively. CK: creatine kinase; IL-6: interleukin-6; SPT-1: serine palmitoyltransferase-1; N-SMase: neutral sphimgomyelinase; A-SMase: acidic sphigomyelinase; Cas-3: caspase-3; R: resting; P0: immediately after exercise; P24: 24 hours after exercise; GR: red region of gastrocnemius muscles; GW: white region of gastrocnemius muscles
