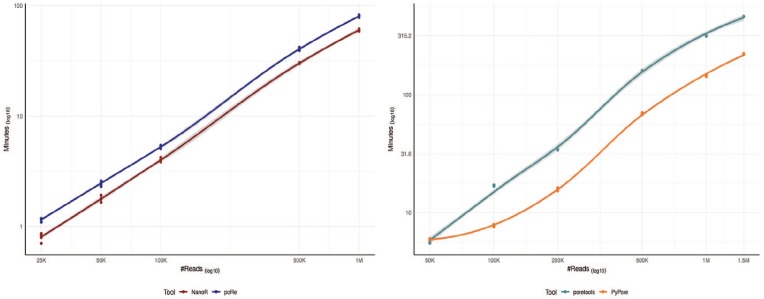
Figure 1.
Speed comparison. Left panel shows LOESS curves comparing speed of NanoR and poRe, both implemented in R. We measured the user waiting-time when extracting metadata from increasing number of sampled FAST5 (25 K, 50 K, 100 K, 500 K, 1 M) using functions from the 2 packages designed for parallelization (NanoTableM from NanoR and extract.fast5 from the poRe parallel GUI). We used 10 Intel® Xeon® CPU E5-46100 @2.40 GHz cores on a 48 cores SUSE Linux Enterprise Server 11. For each number of read, the sampling-extraction step was repeated 5 times. Overall, NanoR is faster than poRe and, for example, it requires ∼60 minutes to extract metadata from 1 M FAST5, whereas poRe ∼80 minutes. Right panel shows LOESS curves comparing speed of PyPore and poretools, both implemented in python. For a fair comparison, we measured the user waiting-time when performing a complete analysis from increasing number of sampled FAST5 (50 K, 100 K, 200 K, 500 K, 1 M, 1.5 M) using a single Intel® Xeon® CPU E5-46100 @2.40 GHz core, as poretools functions are not designed for parallelization. In particular, we compared the speed of seqstats from PyPore with the speed of 5 functions from poretools required to generate a comparable output (poretools stats, occupancy, hist, and yield_plot). For each number of read, the sampling-analysis step was repeated 5 times. PyPore is definitely faster than poretools and, for example, it requires ∼145 minutes to complete the analysis on 1 M FAST5, whereas poretools requires ∼220 minutes. GUI indicates graphical user interfaces; LOESS, locally estimated scatterplot smoothing.

