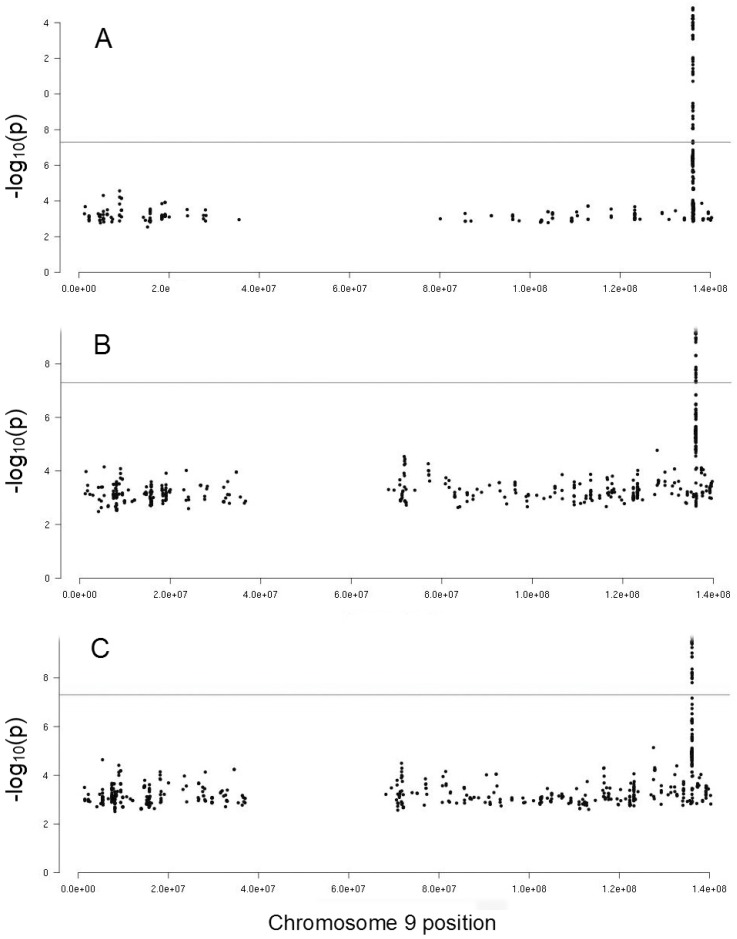
Figure 2.
Manhattan plots of the chromosome 9 region of the GWAS on collagen-ADP closure time phenotype: (A) without adjustments, (B) after adjusting for von Willebrand factor, and (C) after adjusting for factor VIII. Dots correspond to SNPs organized by position and the vertical axis shows the statistical significance expressed as -log10 of the p-values. The horizontal lines mark the 5 × 10⁻⁸ p-value threshold of genome-wide significance.

