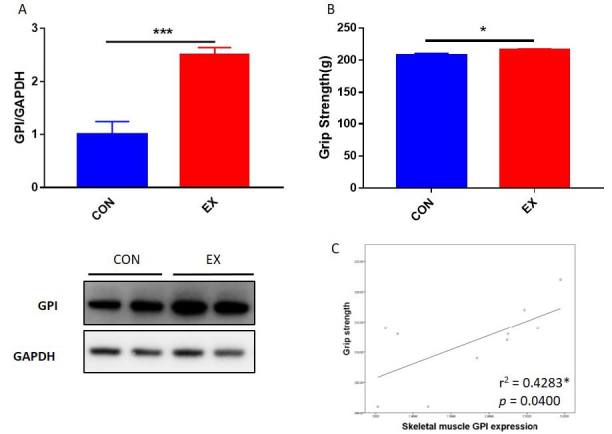
Figure 4. Correlation between muscle function and GPI expression level. (A) GPI expression levels in skeletal muscle of CON (n = 5) and EX (n = 5) groups. (B) Grip strengths of CON and EX mice groups after 2 weeks of treadmill exercise. (C) The correlation of grip strength with GPI expression level in mice skeletal muscle. The lines indicate linear regression, and the Spearman correlation coefficient is shown. *p < 0.05, **p < 0.01, ***p < 0.001.

