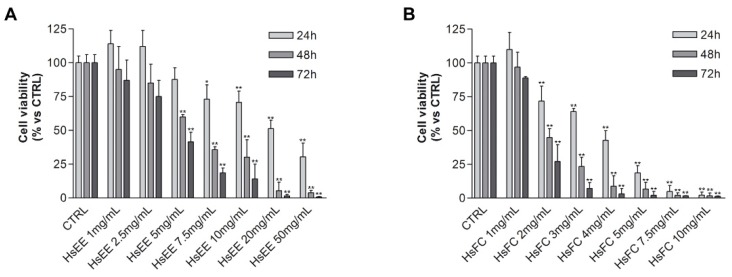
Figure 3.
RPMI 8226 cell viability after HsEE or HsFC treatment. (A) MTT assay of RPMI 8226 cells treated with different concentrations (1–50 mg/mL) of HsEE for 24, 48, and 72 h. (B) MTT assay of RPMI 8226 cells treated with different concentrations (1–10 mg/mL) of HsFC for 24, 48, and 72 h. Untreated cells (CTRL) are control. Graphs represent the mean percentage ± SD of viable cells of three independent experiments (* p < 0.05, ** p < 0.01 vs. CTRL).

