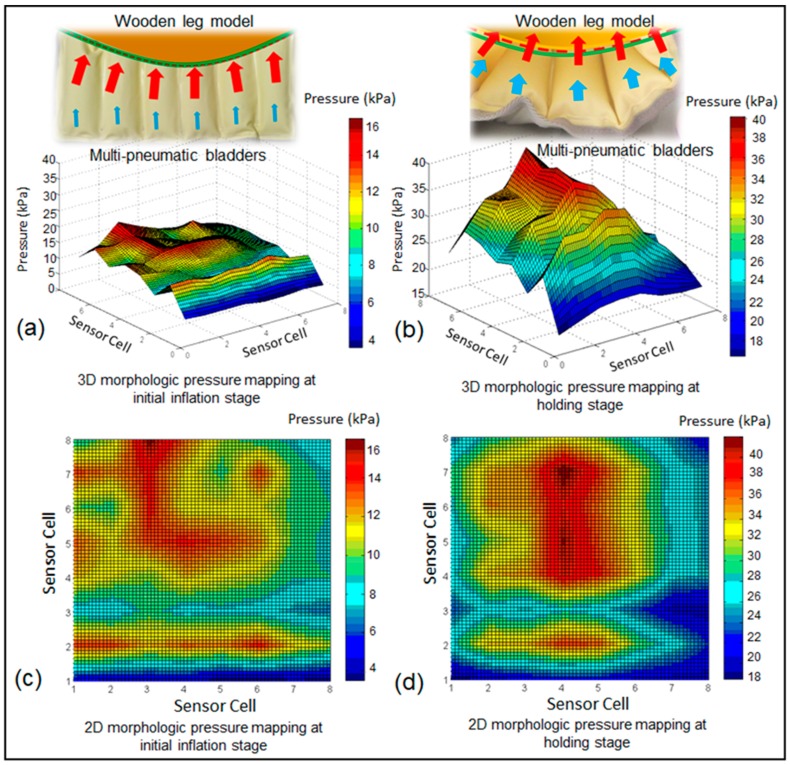
Figure 14.
The 3D and 2D morphological pressure mapping detected by the developed dynamic interface pressure monitoring system at different stages of compression cycles by the IPC in vitro. (a) 3D morphologic pressure mapping at initial inflation stage, (b) 3D morphologic pressure mapping at holding stage, (c) 2D morphologic pressure mapping at initial inflation stage, (d) 2D morphologic pressure mapping at holding stage.

