Figure 3.
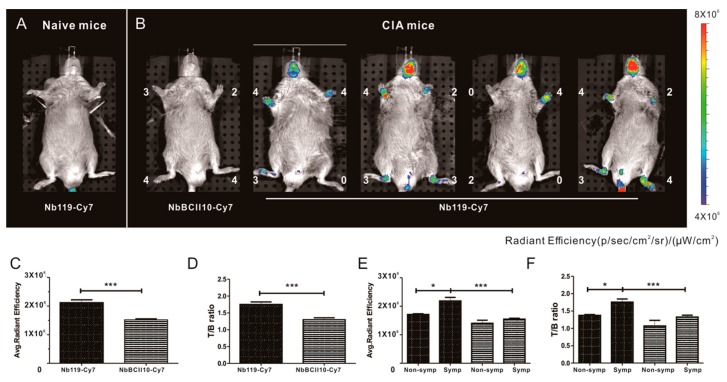
In vivo specific NIRF imaging with Cy7-labeled Nb119 tracer visualizes Vsig4 expression in arthritic joints of CIA mice. Representative NIRF image of CIA mice, 3 h after injection with Cy7 labeled Nb119 or control BCII10. (A) DBA/1 naive mice did not show uptake of Cy7 labeled Nb119. (B) Mice displaying symptoms of arthritis showed specific uptake of Cy7-labeled Nb119 in inflamed joints in correlation with clinical scores but showed no uptake of Cy7-labeled BCII10 control nanobody. Clinical scores are indicated next to each joint. Signal intensities of all injected mice are all equally leveled to allow direct and fair visual comparison. Representative images of five mice per group and at least three independent experiments are shown using National Institutes of Health color scale. NIRF imaging was performed at 3 h after injection. ROIs were drawn around arthritic joints and T/B ratios using NIRF imaging in the absence of potentially confounding signals from hind limb for semi-quantitative analyses. (C) Radiant efficiencies and (D) calculated T/B ratios of Cy7-Nb119 (solid fill) and NbBCII10 (pattern fill) are shown, n = 5 per group. (E) Radiant efficiencies and (F) calculated T/B ratios of Cy7-Nb119 (solid fill) and NbBCII10 (pattern fill) in non-symptomatic joints (non-symp) and symptomatic joints (symp) of five mice are compared. Data are presented as mean ± SEM from at least three independent experiments for each group. Levels of statistical significance are indicated by asterisks (*= p < 0.05, *** = p < 0.001).

