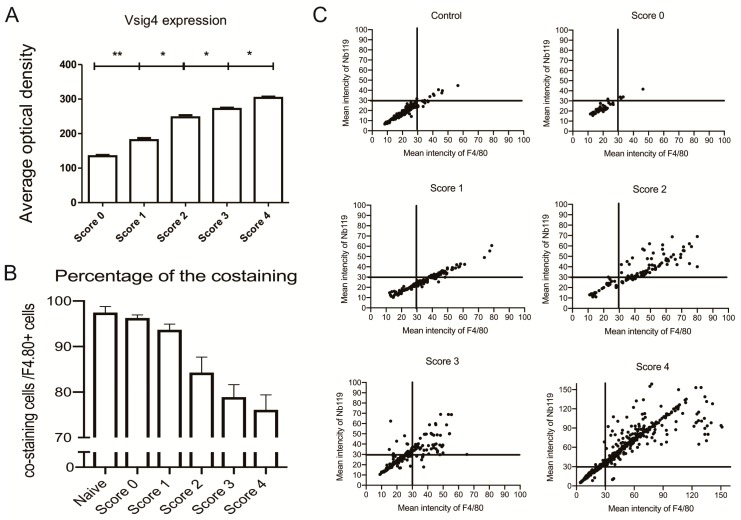
Figure 6.
Immunofluorescence analysis in ankle sections of CIA mice having different clinical scores: (A) Vsig4 expression in total cells; (B) the percentage of Vsig4 and F4/80 contained within F4/80 positive cells. Data are presented as mean SEM. Levels of significance were calculated using one-way ANOVA. Values are means ± SEM (*= p < 0.05, ** = p < 0.01, n = 5). (C) The scatter plots of immunofluorescence analysis for Vsig4 mean intensity vs. F4/80 mean intensity in ankle sections of CIA mice having different clinical scores, scatter plots of left hind ankles from five representative mice are shown for each clinical score group.

