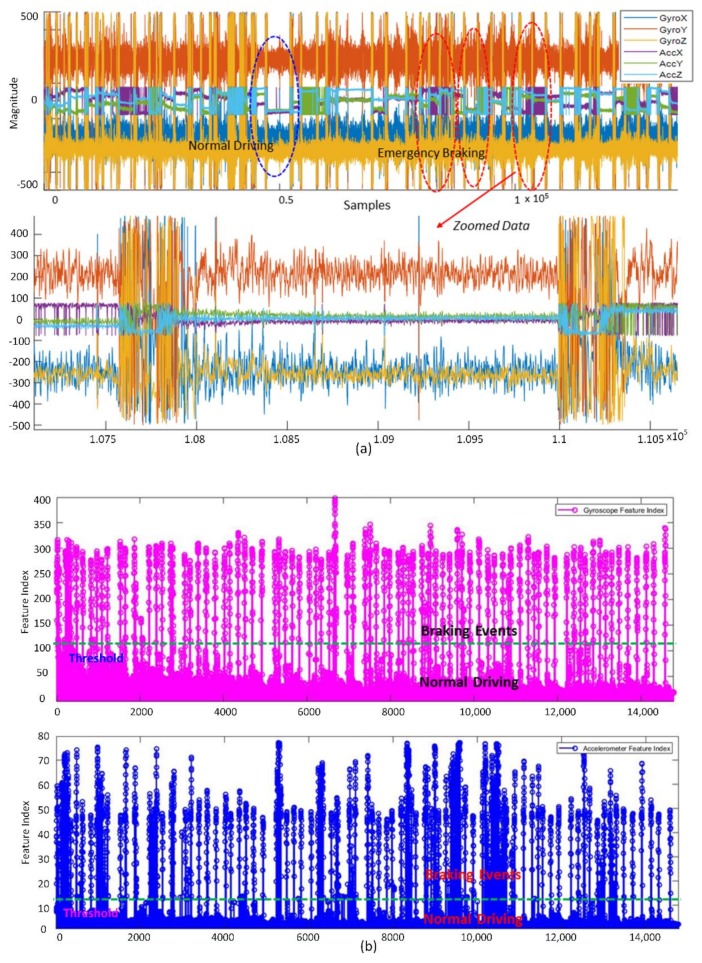
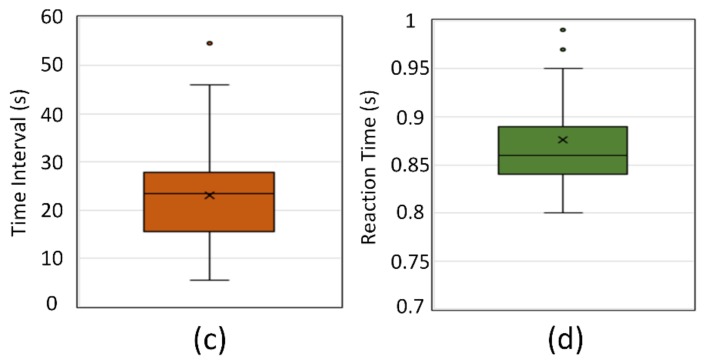
Figure 3.
(a) Accelerometer and gyroscope data for 10 min of driving, with indicators for normal driving and emergency braking events; (b) features of the standard deviation of the windowed data: gyroscope features (top) and accelerometer features (bottom); (c) distribution of the time interval between two consecutive braking events generated by the driving simulator; (d) reaction time measured by the driving simulator.


