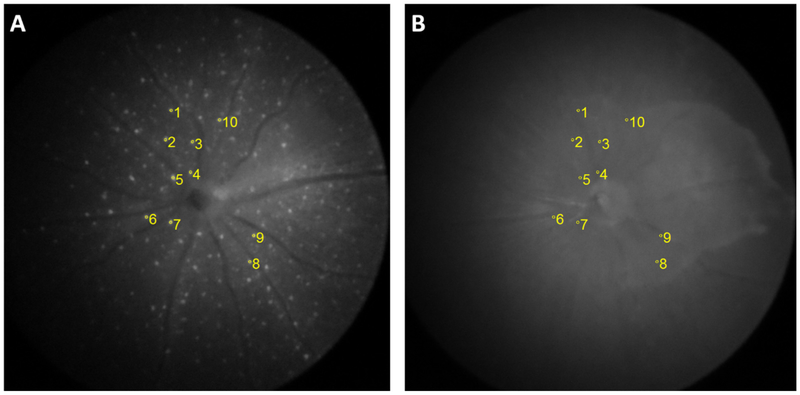
Figure 2:
Calculation of normalized fluorescence intensity of individual cell. Locally selective fluorescence intensity was normalized by the green-field intensity from identical region of interest. (A) Group of cells selected from fluorescence fundus image. (B) Baseline captured from identical location of relevant greenfield image.

