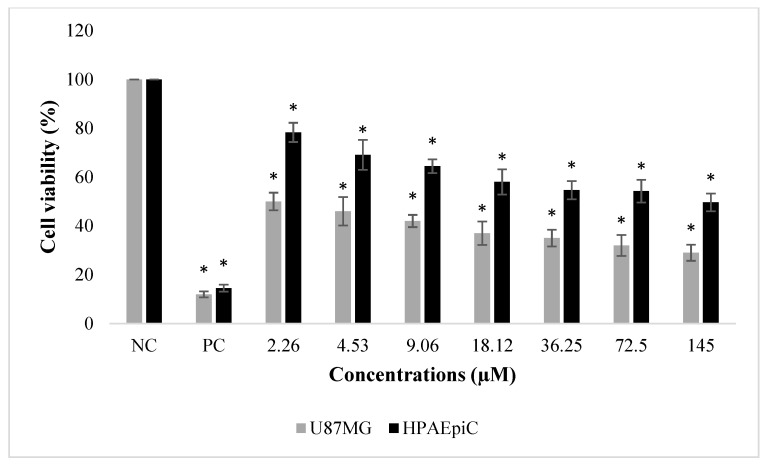
Figure 4.
The effects of NFBTA (2.26–145 µM) on human glioblastoma U87MG and normal human lung (HPAEpiC) cell proliferations for 48 h. Cell viability was determined using the MTT assay. Data are expressed as the mean ± SD of four repetitive experiments. Statistical analysis was carried out by ANOVA and Duncan’s test. (*) symbol presents statistical differences between treated (NFBTA) and untreated (NC) cultures at a significance level of p < 0.05. Paclitaxel was used as a positive control (PC).

