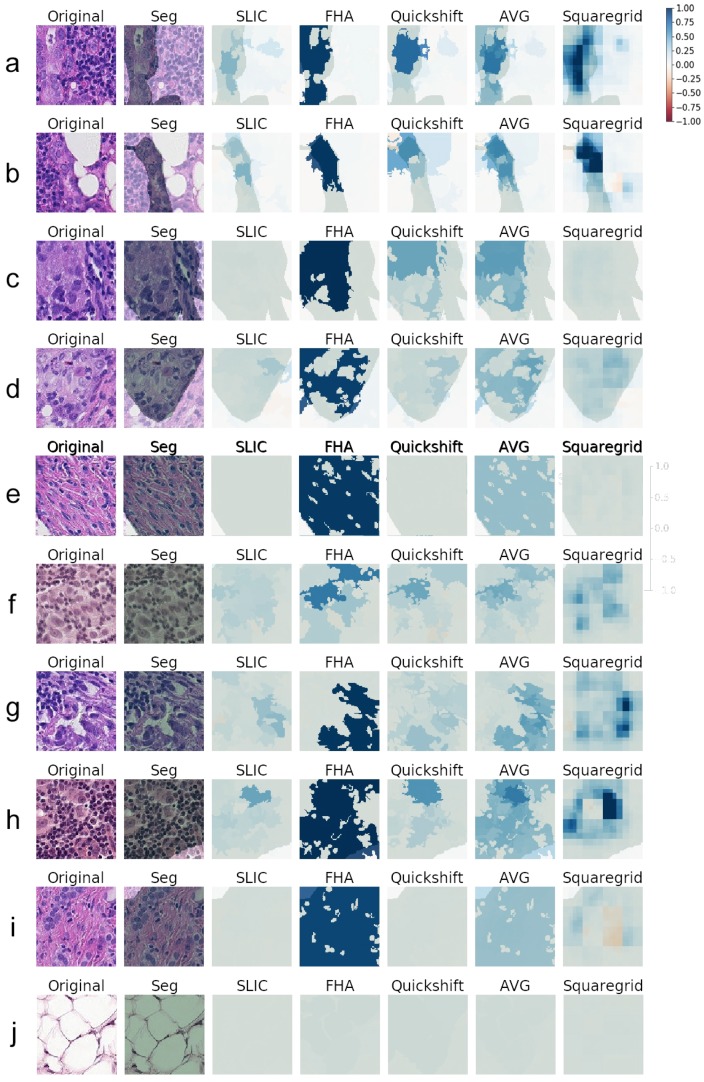
Figure 6.
(a–j) Explanations generated for several images correctly predicted as Class 1 (true positives) by Model1. Medical Segmentation (Seg) in transparent green. All heat maps used the same red-blue color scale with the same limits of [−1,1]. AVG corresponds to the arithmetic average of the SLIC, FHA, and quickshift heat maps.

